| Authors: | Ángeles G. Mayor, V Ramón Vallejo, Susana Bautista with Peter de Ruiter, Lia Hemerik, Violette Geissen, Jaap Bloem, Jacob Kéizer, Óscar González-Pelayo, Ana Isabel Machado, Sílvia Faria, Ana Vasques, Luna Morcillo, Rosario López-Poma, Azucena Camacho, Anna Urgeghe, Diana Turrión, Christel van Eck, Martinho Martins, Paula Maia, Alejandro Valdecantos, Jaime Baeza, Joan Llovet, David Fuentes, Giovanni Quaranta, Rosanna Salvia, Velia De Paola, Ioannis N. Daliakopoulos, Ioanna Panagea, Ioannis K. Tsanis, Michalakis Christoforou, Christiana Papoutsa, Dimitris Tsaltas, Kostas Andreou, Kyriakos Themistokleous, Giorgos Papadavid and Diofantos Hatzimitsis. |
| Editor: | Jane Brandt |
| Source document: | Mayor et al. (2017) Identification of critical changes preceding catastrophic shifts: ecosystems affeced by increasing grazing intensity and severe drought. CASCADE Project Deliverable 3.1b |
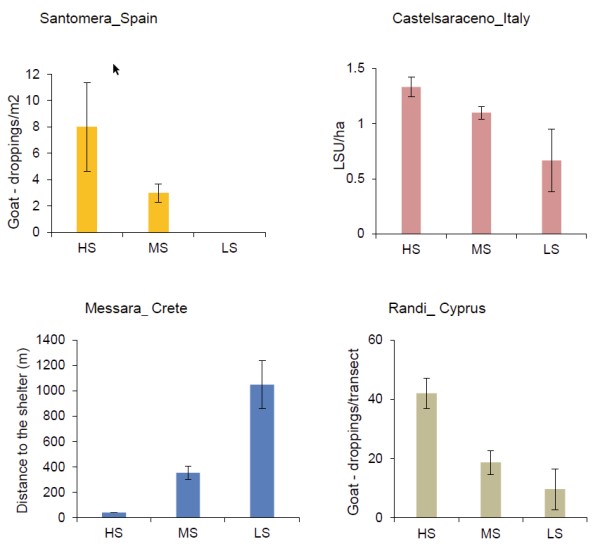
The stress-gradient experiment was carried out in the four sites in which grazing was defined as the environmental stressor. The sites included plots with different grazing intensities. Relative grazing intensity at each site was quantified by different methods, including
- direct measurements of livestock density,
- tracking herd routes to estimate distances to shelters, and
- dropping counts along transects or within sampling plots.
Counts of livestock dung provide a good index of the amount of time that livestock spent grazing in a particular area (Riginos & Hoffman, 2003), and the frequency of goat visits to a particular area decreases with the distance from the shelter, so both variables can be used as comparable indicators.
Based on different indicators, we selected plots that followed a linear gradient of grazing pressure in each site (Figure 1). For this grazing gradient,
- ungrazed (or barely grazed) plots were considered as control plots (hereafter, Low Stress, LS),
- plots under medium grazing intensity were considered as Medium Stress plots (hereafter, MS) and
- plots under high grazing intensity were considered as High Stress plots (hereafter, HS).
Although we established a linear grazing gradient in all sites, there were differences between sites regarding both the type of livestock and the overall grazing pressure. Thus, goats were the main livestock in Randi and Santomera, while livestock in Messara combined goats and sheep, and livestock in Castelsaraceno included goats, sheep and cattle. Overall grazing pressure during the study period was very high in Randi and Messara, moderate in Castelsaraceno and relatively low in Santomera.
For the soil variables, in addition to the grazing-stress factor, we also assessed the effect of the soil microsite (i.e. soil underneath plant patches and soil in the bare-soil interpatches). This factor is relevant in dryland sites, where vegetation is arranged in patches interspersed in a matrix of more or less bare soil. Therefore, we assessed this as an experimental factor in the CASCADE dryland sites with patchy vegetation, Santomera, Messara and Randi, but not in the wettest site (Castelsaraceno), where patches and interpatches could not be clearly distinguished.
For a general description of the sites see
»Albatera, Spain: Description of site and main causes of degradation
»Castelsaraceno, Italy: Description of site and main causes of degradation
»Messara, Greece: Description of site and main causes of degradation
»Randi Forest, Cyprus: Description of site and main causes of degradation
Experimental design
The experimental design for each site therefore consisted of two factors:
- stress level (HS, MS and LS) and
- microsite type (vegetation patch and bare-soil interpatch).
In each study site, three plots of 30 x 30 m size, approximately, were set up at each of the three stress levels and, for each of these plots, 5 vegetation-patch microplots (P microsite) and 5 interpatch microplots (IP microsite) were selected for repeated soil and plant measurements. In each study site, the plots were either interspersed or following a block design, depending on the local conditions. Two main sampling campaigns (spring and autumn) were carried out during approximately one year of study period (mostly in 2013), plus some preliminary exploratory campaigns to define the general soil and plant characteristics of each experimental plot.
Plant and soil measurements
In order to harmonize the sampling and measurement procedures for the assessment of the selected soil-plant system variables (Table 1), an experimental protocol was agreed among the partners. To assess plant performance, we measured
- Plant Height (PH),
- Plant Biomass (PB),
- Plant Cover (PC),
- Twig Basal Diameter (TBD),
- Twig length (TL),
- Branch Basal Diameter (BBD),
- Branch length (BL),
- Specific Leaf Weight (SLW)
- Chlorophyll content (SPAD).
To assess soil functioning, we measured variables related to soil texture, pH, soil carbon and soil nutrient status. The specific variables measured were
- Cation-Exchange Capacity (CEC),
- Soil Organic Carbon (SOC),
- Potentially Mineralisable Nitrogen (PMN),
- Available Nutrients (nitrate, ammonium, phosphate),
- Dissolved Organic Carbon (DOC) and
- Hot Water Extractable Carbon (HWC).
- Soil water content (SWC).
Table 1. Vegetation and soil variables monitored at each site for the grazing stress gradient experiment. The sets of parameters measured per site could slightly differ, because of plant/soil/ecosystem properties and available expertise/equipment.
| Variable types | Santomera (Spain) | Castelsaraceno (Italy) | Messara (Crete) | Randi (Cyprus) | |
| Vegetation | Vegetation growth | Height, Canopy, TBD, TL, Biomass | Height, Plant Cover, Biomass | Biomass | Height, Canopy, BBD, BL |
| Soft eco-physiological traits | SLW, RWC, Huber index, SPAD | SLW, RWC | |||
| Reproductive effort | Flowers, fruits | Spikes | |||
| Soil | Nutrient availability | Available P, PMN, NH4+, NO3- | Available P, NH4+, NO3- | Available P, NH4+, NO3- | Available P, PMN, NH4+, NO3- |
| Labile pool of soil Carbon | DOC | DOC, HWC | |||
| Soil moisture | SWC (Continuous monitoring) | SWC (Continuous monitoring) | SWC (Continuous monitoring) | SWC (Continuous monitoring) |
Acronyms list: ● Vegetation growth: TBD: Twig Basal Diameter; TL: Twig length; BBD: Branch Basal Diameter; BL: Branch length. ● Soft ecophysiological traits: SLW: Specific Leaf Weight; RWC: Relative Water Content; SPAD: Chlorophyll content. ● Soil characterization: CEC: Cation-Exchange Capacity SOC: Soil Organic Carbon. ● Nutrient availability: PMN: Potentially Mineralisable Nitrogen. Available P (Olsen) ● Labile pool of soil C: DOC: Dissolved Organic Carbon; HWC: Hot Water Extractable Carbon. ● SWC: Soil Water Content.
Statistical analyses
Because of the observational character of the stress-gradient experiment, we performed a principal component analysis (PCA) to identify which soil and plant variables were mostly affected by the two factors stress level (S) and microsite (M). In addition, the plant and soil variables were analysed using a General Linear Model (GLM) with two fixed factors (Stress level (S), and Microsite (M)) for the soil data and one fixed factor stress level (S) for the plant variable. All data met normal distribution of residuals and homoscedasticity assumptions. All analyses were carried out by using Statistical package SPSS version 23.0 (SPSS Inc., Chicago, IL, USA).
Note: For full references to papers quoted in this article see