| Authors: | Ángeles G. Mayor, V Ramón Vallejo, Susana Bautista with Peter de Ruiter, Lia Hemerik, Violette Geissen, Jaap Bloem, Jacob Kéizer, Óscar González-Pelayo, Ana Isabel Machado, Sílvia Faria, Ana Vasques, Luna Morcillo, Rosario López-Poma, Azucena Camacho, Anna Urgeghe, Diana Turrión, Christel van Eck, Martinho Martins, Paula Maia, Alejandro Valdecantos, Jaime Baeza, Joan Llovet, David Fuentes, Giovanni Quaranta, Rosanna Salvia, Velia De Paola, Ioannis N. Daliakopoulos, Ioanna Panagea, Ioannis K. Tsanis, Michalakis Christoforou, Christiana Papoutsa, Dimitris Tsaltas, Kostas Andreou, Kyriakos Themistokleous, Giorgos Papadavid and Diofantos Hatzimitsis. |
| Editor: | Jane Brandt |
| Source document: | Mayor et al. (2017) Identification of critical changes preceding catastrophic shifts: ecosystems affeced by increasing grazing intensity and severe drought. CASCADE Project Deliverable 3.1b |
1. Effect of grazing-stress on soil quality
Results
Figure 1a summarizes the effect of grazing pressure on the overall soil condition in the four CASCADE study sites for which grazing pressure is the main degradation driver; only results for autumn season are shown, but spring data showed similar patterns (see Annex I for detailed description of effects on individual variables and seasons).
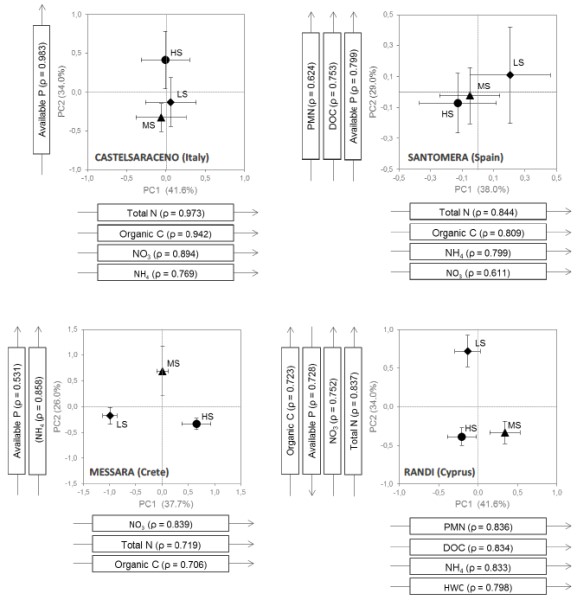
Figure 1a 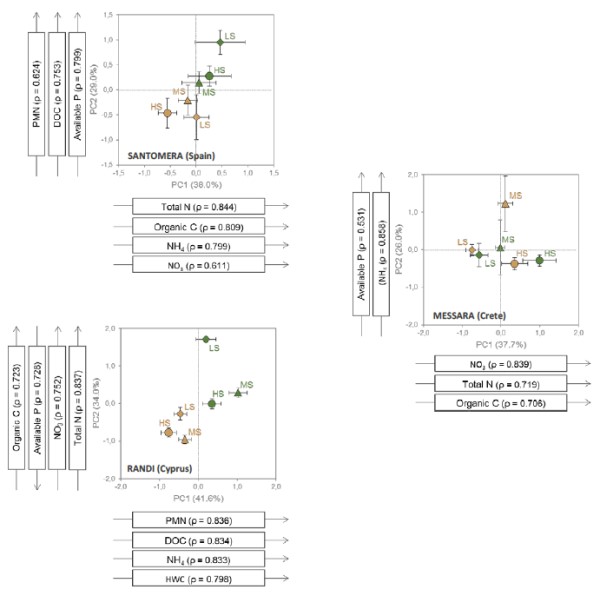
Figure 1b
Data represent means ± SE of axis scores for each stress level. Arrows represent soil variables significantly correlated (|ρ| ≥ 0.6) with the first two axes. LS: low stress (diamonds); MS: moderate stress (triangles); HS: high stress (bullets).
The multivariate (PCA) analysis performed on soil data yielded two main axes in all sites. However, the particular variables that correlated with each axis varied between sites. In Castelsaraceno and Santomera, the wettest and driest site respectively, soil condition did not significantly vary between grazing-stress levels, showing higher variation within each stress level than between levels. However, in Santomera, all soil variables combined in the two PCA axes showed a gradual gradient towards higher nutrient availability and larger amounts of soil organic N and C from high-stress to low-stress plots. Conversely to the previous two sites, soil data from Messara and Randi showed clear variations between stress levels. PC1 in Messara (which positively correlated with total N, SOC, and nitrates) showed a gradual increase from low-stress to high-stress, while PC2 in Randi (which also positively correlated with total N, SOC, and nitrates, and negatively correlated with available P) showed a sharp degradation from low- and moderate-stress to high-stress. In Messara, PC2 correlated with available P and ammonia and showed higher values for moderate-stress than for the other two levels. Similarly, in Randi, PC1, which correlated with ammonia, PMN and labile forms of organic matter, showed higher values for moderate-stress than for the other two levels.
Figure 1b summarizes the effect of grazing pressure on the overall soil condition of patch versus interpatch microsites (only for the study sites with patchy vegetation: Santomera, Randi, and Messara). Results for Messara were scattered, but in Santomera and Randi patch and interpatch microsites were clearly separated, with patch microsites showing higher values for soil quality variables such as PMN, DOC and Available P (Santomera) and Organic C (SOC), Available P, NO3 and Total N (Randi). For these two sites, overall differences in soil condition in response to the stress gradient were higher for patch microsites than for interpatch microsites.
For each CASCADE study site with patchy vegetation, Figure 2 shows the variation in the patch/interpatch ratios for soil variables as a function of the grazing stress level. All soil variables showed higher values in soils underneath plant patches than in the interpatches, with the exception of Total N in Messara site and in medium- and low-grazing areas in Santomera site, which showed ratios close to 1. The ratios patch/interpatch were especially high in Randi site. In Randi, patch/interpatch ratios significantly increased from low stress to medium or high stress levels for SOC, ammonium and PMN (Table 1). The same trend (p<0.1) was observed for SOC in Messara and for total N in Santomera. Conversely, DOC ratio in Santomera and available P ratio in Messara were significantly (p<0.1) higher for low grazing-stress than for medium or high stress. The rest of variables did not show any significant effect of the grazing-stress level (Table 1).
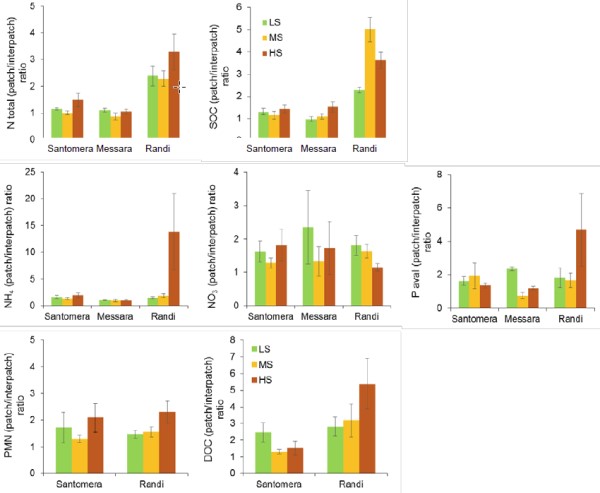
Figure 2
Table 1. Statistics results (F and P-values) of the analysis of variance (ANOVA) on the patch/interpatch ratios of the soil variables assessed for Santomera, Messara and Randi sites as a function of the grazing-stress level.
| Santomera | Messara | Randi | |
| F(P) | F(P) | F(P) | |
| Total N | 2.9(0.072) | 1.4(0.267) | 1.3(0.282) |
| SOC | 0.7(0.511) | 2.9(0.079) | 12.3(<0.001) |
| NH4 | 0.9(0.411) | 0.1(0.891) | 2.9(0.068) |
| NO3 | 0.8(0.464) | 0.3(0.737) | 2.4(0.101) |
| Avail-P | 1.1(0.358) | 2.8(0.089) | 1.6(0.207) |
| PMN | 1.6(0.216) | 2.7(0.080) | |
| DOC | 2.6(0.091) | 1.6(0.213) |
SOC: Soil organic carbon; NH4: ammonium; NO3: nitrates; Avail-P: available phosphorus; PMN: potentially mineralisable nitrogen; and DOC: dissolved organic carbon. Significant results (p<0.05) are highlighted in bold and marginally significant results (p<0.1) in italics.
Discussion
It is assumed that the interplay between small scale facilitation (local facilitation) and large scale competition (global competition) between plants underlie catastrophic shifts in drylands (Rietkert et al. 2004). Local facilitation is especially relevant under relatively harsh conditions (He et al. 2013). However, under certain (high) levels of the pressure facilitation may no longer counterbalance the overall competition for scarce resources, leading to a sudden shift towards a degraded state. Facilitation is exerted through multiple mechanisms that, in general, imply improved soil conditions underneath and near plant patches, particularly higher water infiltration capacity (Mayor et al. 2009) and nutrient cycling (Mayor et al. 2016). Here, we assessed changes in the degree of soil improvement as a function of a grazing-stress gradient. In doing so, we aimed to identify functional thresholds (Bestelmeyer, 2006) that might occur after a critical decrease in the soil-plant system took place.
In two of our study sites, Castelsaraceno and Santomera, soil quality parameters did not significantly vary between grazing-stress levels. These two sites represented the wettest and the driest CASCADE sites, respectively, and an overall moderate-low grazing pressure. The relatively low grazing intensity of the ranges considered in both cases could be the most plausible cause for the lack of effect of the stress gradient. Mediterranean rangelands are quite resilient against moderate grazing pressures, which do not significantly hamper ecosystem services provision in these areas (Papanastasis et al. 2015).
An alternative or additional possible explanation for the lack of effect of the grazing level in these two sites might be that the effect of grazing interacts with climatic effects, with the importance of grazing pressure somehow reduced under the most extreme climatic conditions. Castelsaraseno is a relatively wet site with high vegetation cover. These conditions might make the soil ecosystem robust enough to deal with the current range of grazing levels. Santomera is a very dry site, and for this site one might argue that soil conditions are mainly affected by water as the limiting factor for vegetation cover and growth, which in turn determine soil quality parameters.
Conversely, Messara and Randi showed clear effects of grazing-stress levels with some soil quality indicators (PMN, ammonium, available P and labile C forms) peaking under moderate grazing stress and further decreasing under high grazing stress in both sites, and some other indicators (SOC and total N) either decreasing (in Randi) or increasing (in Messara) with increasing grazing pressure. In Randi, we also found the largest differences between the values in the patches compared to the interpatches. For several soil variables, these differences increased with the level of grazing pressure. Only in the case of soil organic carbon, we observed a unimodal response, with the highest contrast between patch and interpatch values at medium level of stress and a further decrease in this contrast at the highest stress level. In the proximity of a critical shift, we expect increased spatial (and temporal) variance (Guttal and Jayaprakash 2009), which will be then reduced after the shift to a degraded state. According to this framework, our results suggest that the range of grazing pressure assessed in the Randi site includes conditions that may drive the system to a sudden shift into a degraded state.
2. Effect of grazing-stress on plant performance
Results
Figure 3 gives the results found for canopy area (CA) and twig basal diameter (TBD) of the shrub target species in Santomera and Randi sites. In Santomera, the canopy of the species Anthyllis cytisoides clearly increased in spring time (3 months of monitoring), regardless of the grazing-stress level (Figure 3). After this peak, the canopy area sharply decreased during the summer period. While the variation in canopy area with time was highly significant, this variable did not show any significant effect of the stress level (Table 2). In the case of the shrub species Calicotome villosa, the target species in Randi, canopy growth showed significant differences among stress levels (Table 2), with the highest growth in canopy observed for the low-stress level, whereas the lowest values were observed for the high-stress level (Figure 3). In Santomera, Anthyllis twigs grew during the first 6 months of monitoring, until the beginning of the summer season. After that, only plants under high stress level continued growing while plants at low and medium stress levels became stagnant. Conversely, for Calicotome plants in Randi, the change in the branch basal diameter followed the same pattern as the overall canopy size, growing significantly more for low and moderate grazing stress, and barely growing for high-stress plots (Figure 3; Table 2).
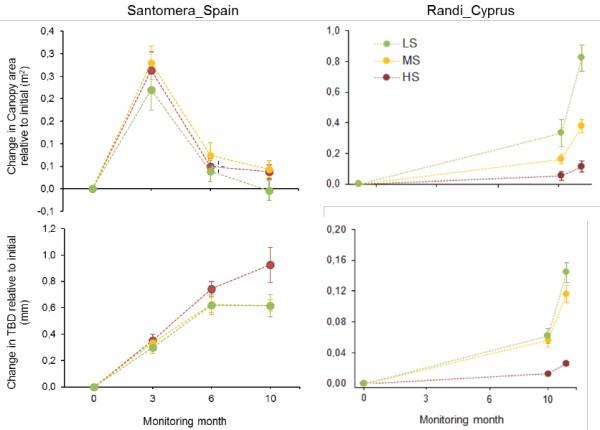
Figure 3 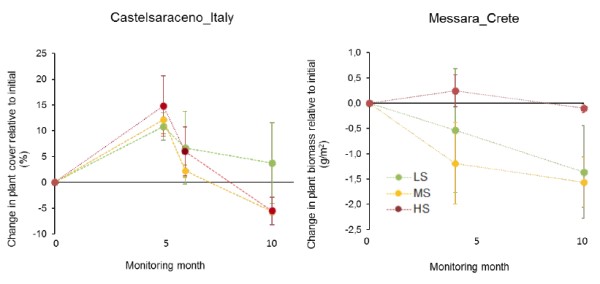
Figure 4
Figure 4 shows the changes in plant cover and biomass for the perennial grass species Brachypodium rupestre and Hyparrhenia hirta in Castelsaraceno and Messara, respectively. The change in plant cover for B. rupestre, relative to the initial values, did not show any clear differences among stress levels during the first six months of monitoring (Figure 4). However, the recovery of plant cover after the seasonal decay was significantly higher (Table 2) for the low-stress level than for the other two levels. In Messara, the changes in plant biomass did not show any significant effect of the stress gradient (Figure 4; Table 2)
Table 2. Statistics results (F and significance, P) of the Repeated Measures Analysis of variance (ANOVA) for the variables “change in canopy relative to the initial”, “change in twig basal diameter (TBD) relative to the initial”, “change in plant cover relative to the initial” and “change in plant biomass relative to the initial” for Santomera, Castelsaraceno, Messara and Randi respectively. We used Time (T) as a within-subject factor and Stress level (SL) as an intersubject factor. Significant results (p<0.05) and highlighted in bold and marginally significant results (p<0.1) in italics.
| Santomera | Castelsaraceno | Messara | Randi | ||
| Factor | F(P) | F(P) | F(P) | F(P) | |
| Change in canopy | T | 72.4(<0.001) | 180.3(<0.001) | ||
| SL | 1.1(0.334) | 19.9(<0.001) | |||
| T*SL | 0.2(0.940) | 44.3(<0.001) | |||
| Change in TBD | T | 43.7(<0.001) | 156.2(<0.001) | ||
| SL | 4.8(0.013) | 31.1(<0.001) | |||
| T*SL | 2.5(0.046) | 23.8(<0.001) | |||
| Change in plant cover | T | 48.7(<0.001) | |||
| SL | 1.0(0.370) | ||||
| T*SL | 3.9(0.008) | ||||
| Change in biomass | T | 2.7(0.152) | |||
| SL | 0.7(0.523) | ||||
| T*SL | 0.4(0.701) |
Discussion
In Santomera, canopy cover and basal twig diameter of Anthyllis cytisoides did not vary noticeable with stress level although there was a trend towards higher twig growth for the high-stress plots, probably due to compensatory growth (Oesterheld and McNaughton 1991) under grazing intensities that were not particularly stressful in absolute terms. In Randi, Calicotome villosa canopy cover and branch basal diameter showed higher values for low and intermediate stress level and low values for high stress. In Castelsaraceno and Messara, plant cover and biomass of the two target species Brachypodium rupestre and Hyparrhenia hirta respectively, did not show clear differences among stress levels, except for a slightly higher recovery in plant cover after the seasonal decay for low-stress plots in Castelsaraceno.
An explanation for these results might be found along a similar kind of reasoning as for the grazing effects on soil quality. Santomera is a water controlled ecosystem with, in our study, relatively small effects of grazing. Castelsaraseno is a relatively vegetation rich ecosystem with a high robustness against stress imposed by grazing. Messara showed response in soil quality to stress through grazing, but apparently no response by the vegetation. Only the Randi site show a comprehensive pattern of results with sensitivity for grazing on both the level of soil quality an on vegetation performance.
Note: For full references to papers quoted in this article see