Indicators of critical thresholds
| Contributing Authors: | Sonia Kéfi, Florian Schneider, Alain Danet, Alexandre Génin, Angeles G. Mayor, Susana Bautista, Max Rietkerk, Koen Siteur |
| Editor: | Jane Brandt |
| Source document: | Kéfi, S., Schneider, F. Danet, A., Génin, A. Mayor, A. G., Bautista, S. Rietkerk, M. Siteur, K. 2017. Report on indicators for critical thresholds. CASCADE Project Deliverable 6.2, 26 pp |
In CASCADE we have developed a number of dryland vegetation models, starting from existing dryland models and sequentially including additional ecological mechanisms thought to be relevant for drylands' ability to cope with increasing pressures. These mechanisms include
- modeling more realistic grazing pressures,
- modelling the effect of fire,
- taking the variability of the external pressure (rainfall) into account,
- incorporating different types of feedbacks such as erosion feedbacks known to be important for dryland functioning,
- taking different plant functional groups into account as a first step into taking more species characteristics into account.
For more details see »Simulated pressures and ecosystem responses
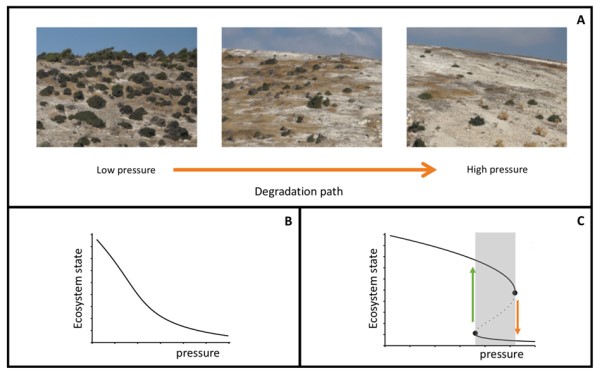
In particular our models can exhibit alternative stable states, and thereby possible shifts, between these alternative states, because of the presence of positive feedback loops between the different ecosystem components. This means that for a range of conditions the ecosystem can be in one of two possible ecosystem states, for example one with high vegetation cover (Figure 1A left picture) and another with low or no vegetation cover (Figure 1A right picture). In such an ecosystem with two alternative stable states, referred to as a bistable system, small changes in environmental conditions lead to gradual ecosystem responses until a threshold, or tipping point (black dots in Figure 1C), is reached at which the ecosystem shifts abruptly from one ecosystem state to a radically different one (orange and green arrows in Figure 1C). These shifts are typically difficult to reverse once they have happened, if the recovery is possible at all. Such abrupt ecosystem responses are known as catastrophic shifts.

A: picture of a Mediterranean dryland ecosystem along a degradation gradient (from low stress in the left to higher stress on the right; pressure = grazing in this case). Photo credit: F.D. Schneider. Some ecosystems respond in a continuous, gradual and reversible way to increasing pressure (B), while others respond in an abrupt and unexpected manner (C). Solid lines represent the stable state of the ecosystem (e.g. vegetation cover in the case of Mediterranean drylands), black dots represent tipping points, and dashed lines represent the unstable state (the limit between the attraction basins of the stable states). In the case of the discontinuous ecosystem response of C, there is a range of pressure for which the ecosystem can be in either of two possible states (bistability area, in grey, between the tipping points) depending on the history of the system. In such a case, we are interested in identifying indicators of approaching tipping points (e.g. distinct behavior of some metric that would occur just before the collapse of the upper ecosystem state into the lower one, i.e. just before the ecosystem degrades along the orange arrow).
If drylands can tip unexpectedly to a degraded state due to environmental changes, it is crucial to be able to detect such response in advance to prepare for it or avoid it. There are a number of indicators of ecosystem degradation available in the literature. For drylands, the probably most common one is the total amount of vegetation cover. However, this indicator would typically fail in case a dryland is approaching a tipping point to desertification, because then the ecosystem abruptly shifts to a desert when it still has a relatively high vegetation cover. In the last two decades, theoretical studies have suggested the existence of generic early-warning signals that may indicate if a tipping point is approached in a wide range of systems. Additionally, in drylands, indicators related to the spatial structure of the vegetation cover have been proposed.
In this section of CASCADiS we
- review the generic early-warning signals available in the literature – those particularly available to drylands
- evaluate and discusse the applicability and limits of these indicators and
- propose new indicators.
For more details see »Identification of the indicators.
Then we
- test the patch-based indicators on field data.
For more details see »Validation of the indicators.
Finally we
- review the main results, implications for management and outlook for improving the indicators and
- share the models.
See »Results, implications and outlook and »Early warning signals toolbox.
Related articles
