| Contributing Authors: | Sonia Kéfi, Florian Schneider, Alain Danet, Alexandre Génin, Angeles G. Mayor, Susana Bautista, Max Rietkerk, Koen Siteur |
| Editor: | Jane Brandt |
| Source document: | Kéfi, S., Schneider, F. Danet, A., Génin, A. Mayor, A. G., Bautista, S. Rietkerk, M. Siteur, K. 2017. Report on indicators for critical thresholds. CASCADE Project Deliverable 6.2, 26 pp |
The development of early warning signals to detect the onset of regime shifts in marine and terrestrial ecosystems has received increasing attention during the last decade. The theoretical interest for these indicators has created a novel and promising framework for studying tipping points in ecological systems. The challenge, however, is whether these indicators can be applied in reality.
To evaluate the indicators, and more precisely the patch-based indicators, as indicators of dryland degradation, we used a data set from another European project, BIOCOM, coordinated by Fernando Maestre (Madrid, Spain) [44]. This work is part of the Ph.D. thesis of Miguel Berdugo, co-supervised by Sonia Kéfi, Fernando Maestre and Santiago Soliveres. The database contains vegetation and soil data of 224 drylands from all around the world. For each site, the dataset contains the estimated plant cover, the frequency of positive plant-plant interactions, 16 soil variables (related to the carbon, nitrogen and plosphorous cycles) hereafter called ‘functions’, and the aridity index (AI, precipitation/potential evapotranspiration).
From these sites, we retained for this study those from which we could gather »»Google EarthTM or »»VirtualEarthTM images good enough for visually identifying vegetation patches. The resulting 115 sites used for the analyses are located in 13 countries and differ widely in their abiotic (elevation, temperature and precipitation) and biotic (vegetation type, cover and number of species) features.
We used the combination of remote sensing and field data to evaluate the links between vegetation cover, patch-size distribution and multifunctionality (the ability of ecosystem to provide several soil fertility related services at the same time; it was measured as the average Zscore of the 16 soil variables; see [44] for a description of the approach).
We found that the observed vegetation patch-size distributions always fitted heavy-tailed distributions with varying levels of curvature (see »Identification of the indicators). Distributions showing strong curvatures have a relatively low proportion of patch sizes that fit a power law (i.e. a low Power Law Range, hereafter referred to as PLR). These curvatures are caused by the lack of the largest and/or of the smallest vegetation patches compared to what would be expected in a pure power law: PL-like sites whose patch size distribution fits best a power law, and ii) and non PL-like sites which had more curved distributions.
Moreover, we found a bimodal distribution of multifunctionality values in our field sites, which suggests contrasting multifunctionality states in global drylands. This can be interpreted as the existence of two alternative states in multifunctionality in global drylands. More specifically, mapping the number and value of estimated alternative states along the aridity gradient studied reveals a range of aridity values (between 0.2 and 0.4, meaning that 1-AI is between 0.6 and 0.8) for which two multifunctionality levels coexist across our sites (Figure 7). The type of patch-size distribution was significantly associated with the two multifunctionality states observed (PL-like sites in the upper branch and non-PL-like sites in the bottom branch).
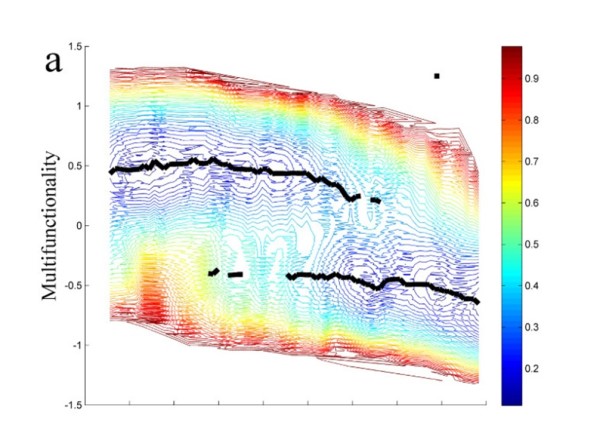
Variation of the ‘stable’ states (i.e. local minima of the stability landscape (black line) along the aridity gradient studied for multifunctionality. AI = aridity index (annual precipitation / annual evapotranspiration). Contour lines represent the estimated potential energy from which the ‘stable’ states are derived as local minima, i.e. blue color represent more stable states and red color represent less stable states. Figure from [45].
Changes in patch-size distributions indicate a spatial reorganization of the existing cover, which is related to processes influencing the functioning of drylands, such as soil erosion. Modifications in spatial patterns can also reflect important variations in the structure of plant communities unrelated to changes in cover.
Note: For full references to papers quoted in this article see