| Contributing Authors: | Matteo Jucker Riva, Gudrun Schwilch, Hanspeter Liniger |
| Editor: | Jane Brandt |
| Source document: | Jucker Riva, M., Schwilch,G., Liniger, H. 2016. A method for resilience assessment. CASCADE Project Deliverable 7.2, 61 pp |
Section 2 of the »Resilience Assessment Tool is used to evaluating the perception of land users of their land. This is important not only because effective land management practices have to be compatible with the livelihood strategies of the land users and with their perception of the environment, but also because the identification of what is to be considered "healthy" and what is considered “degraded" is context- and culture- dependent and can be very different between scientists and land users. The understanding of which changes are desirable and which not has to be defined in a participatory manner. A major example of how differently scientists and land users can perceive the state of the land is presented in Figure 1.
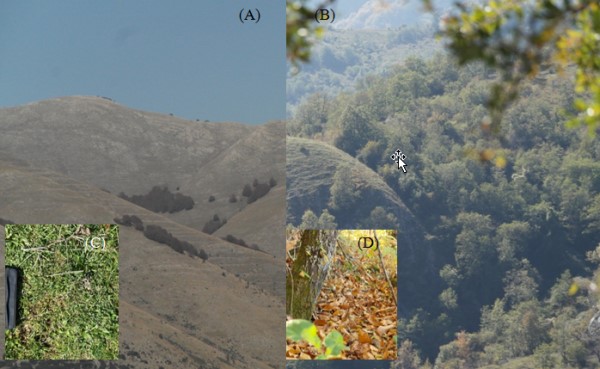
Table 1: Classification used in the RAT for the services / functions that the land management system should provide.
Selected from the WOCAT Technology questionnaire.
| P: Productive Services | E: Ecological services |
S: Socio cultural services |
|
|
|
The data that composes Table 2 has been collected in two different ways.
- By asking stakeholders the following question (2.1.): “What are the functions or services the land management system should provide?” according to a list of ecosystem services selected from the WOCAT questionnaire to meet the specifics of the CASCADE study sites (c.f. Table 1).
- By submitting a small questionnaire directly to land users and managers. This questionnaire, called Environmental Perception Questionnaire (EPQ), once translated in all the study sites' languages, has been submitted to a group of stakeholders as diverse as possible, during stakeholder meetings or one- to-one interviews. For each “environmental property”, responders were asked to value the importance on a scale from 1 to 4 and to assess the state of degradation: either “to maintain” (healthy) or “to improve” (degraded). The results detail the perception of the state of degradation of the land management system, as well as the demand for ecosystem services. (cf. Annex 2 for the complete Environmental Perception Questionnaire). The number of responders varies greatly (see Table 2, because we selected only those stakeholders with a direct relationship with the land management system analyzed: land owners/users, advisors (e.g. forestry service, fire protection, public or private advisory), administrators in charge of the area (municipality, regional government). We present the results of the evaluation of the ecosystem services in Figure 2 and in Table 3 column 2, while the results of the EPQ are presented in Table 3 columns 3, 4 and 5, in Figure 3.
Table 2: Number of responders to the Environmental Perception Questionnaire per land management system
| Study site | Por_1 (Várzea) | Por_2 (Várzea) | Spa_2 (Ayora) | Spa_3 (Ayora) | Gre_1 (Messara) | Cyp_1 (Randi) | Ita_1 (C. Saraceno) | Spa_1 (Albatera) |
| Number of responders | 1 | 4 | 10 | 12 | 10 | 9 | 8 | 3 |
1. Relative importance of different ecosystem services categories
The graphs shown in Figure 2 are computed based on the answer to question 2.1.1 “Importance of services and functions”, in which the expert performing the assessment was asked to rank the different categories of ecosystem services according to their importance, integrating the opinions of relevant stakeholders. The results show the demand for ecosystem services in the land management systems.
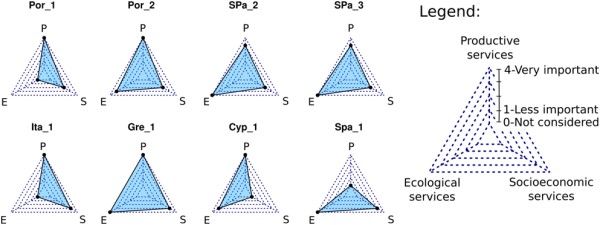
(see »Resilience Assessment Tool for the list of variables.)
Productive services are indicated as “very important” in most of the study sites (Por_1, Por_2, Gre_1, Cyp_1, Ita_1), while ecological services are the most important only in areas that are not used intensively for production (Spa_1, Spa_2).
Socio-cultural services are generally more important in grazing areas compared to forests, probably due to the personal attachment and the long tradition of animal farming that is related with pastures, while forest areas are more considered for their ecological value. Obviously these results are largely influenced by the composition of the stakeholder group. However, by selecting only stakeholders that have a direct relationship with the area, as well as aiming at a highly diverse group of responders in terms of profession, age and relation to the area, we feel that the RAT evaluation is reliable for the land management system assessed.
2. Assessment of healthy and current state
By enquiring about the current provision of ecosystem services and on the stae of the environment, we are able to compare the current situation to the healthy one, and also to relate the state of the environment with the provision of ecosystem services. Table 3 allows comparing the most relevant information from both Section 2.1 of the RAT and the Environmental Perception Questionnaire. The second and fifth column of Table 3 show the provision of services as assessed by experts (c.f. previous paragraph), while column 3, 4 and 6 show the evaluation resulting from the Environmental Perception Questionnaire.
Table 3: Evaluation of the healthy and current state of the land management system.
| Study site identifier | Most important ecosystem services | Most important "healthy" environmental features | Most important "degraded" environmental features | Services provided at a satisfactory level | Env. properties considered healthy b ‡ |
| Por_1 (Várzea) |
|
-- † | -- † | 44.40% | -- † |
| Por_2 (Várzea) |
|
|
|
0% | 24.30% |
| Spa_2 (Ayora) |
|
|
|
88.90% | 40.20% |
| Spa_3 (Ayora) |
|
|
|
0% | 51.40% |
| Gre_1 (Messara) |
|
|
|
71.40% | 64.90% |
| Cyp_1 (Randi) |
|
|
|
16.70% | 32.60% |
| Ita_1 (Castel Saraceno) |
|
|
|
0% | 73.80% |
| Spa_1 (Albatera) |
|
-- † | -- † | 61.90% | -- † |
Column 2 and 4 are based on the question: “What are the functions or services the land management system should provide?” of the RAT, column 3, 4 and 6 on the question: “Which properties of the environment are to be maintained or improved?”asked directly to stakeholders through the Environmental Perception Questionnaire. Values in column 5 and 6 range between 0 (completely degraded) and 100% (completely healthy). If the value is above 50%, the system is considered healthy. The values in column 5 and 6 have been calculated using the formula presented in »Design of the Resilience Assessment Tool.
a Weighted percentage of ecosystem services that are considered healthy /sufficiently provided
b Weighted percentage of environmental properties considered healthy
† Not enough responses to the Environmental Perception Questionnaire were collected
Considering the current state of the environment, most of the land management systems analyzed are considered degraded, with Por_2 being the most degraded, while Ita-1 is considered the healthiest.
It is interesting to notice how the evaluation through the Environmental Perception Questionnaire (column 6) does not necessarily correspond to the assessment of the most important ecosystem services (column 5). Ita_1 that was considered healthy by the stakeholders in all the categories of environmental properties, while the provision of services was considered highly unsatisfactory. The reason of this difference probably lies in the fact that land use productivity in the Italian study site is hindered by the economic system and regulatory restrictions, rather than environmental constraints. Thus, stakeholders perceive a problem in the provision of services but not in the state of the environment.
Por_2, that was considered the traditional, less sustainable land management system in the Várzea study site, is evaluated as providing less services than Por_1, where a more sustainable management practice for post-fire logging was adopted. Also, in the Ayora study-site, Spa_2, which is a semi-natural forest, is considered degraded, while Spa_3, that is located near a shrubland area (in ecological terms this is the "degraded" state of the forest present in the study site) is considered "healthy". If we look at the evaluation of the provision of ecosystem services, the relation between the two land management systems analyzed in the Ayora study site is the opposite. This might be related to the fact that while Spa_2 is a forest with environmental properties that are similar to the other forest stands in the area, thus providing several ecosystem services, Spa_3 is a shrubland that does not provide important ecosystem services. But due to the particular land management that changed vegetation composition, it is considered healthier than most other shrubland formations in the area and more resistant to fire.
Gre_1, where pastures were restored using Carob trees and managed grazing is considered healthy, is in agreement with the evaluation of ecosystem services provision. Cyp_1 which is a traditional pasture in a very dry area is considered degraded despite the number of land management practices implemented, probably because the overall productivity remains low, despite the land management which is mostly focused on mitigating degradation.
3. Relative importance of different environmental properties
Beyond the evaluation of the state of the system, the results of the Environmental Perception Questionnaire provide a more detailed description of the relationship between land users and their environment. A detailed analysis of the EPQ results is presented in the following figures. Firstly how land users have judged the importance of different environmental properties, and secondly how they have assessed the state of the environment.
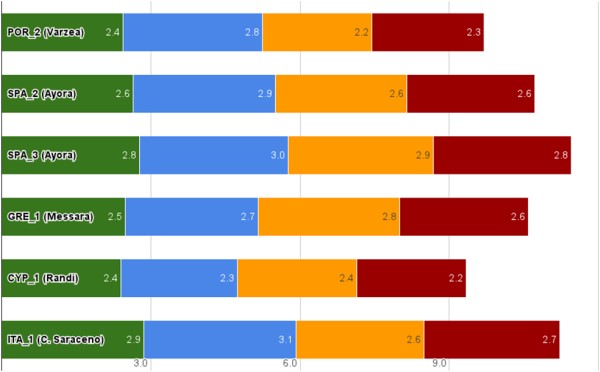
Figure 3 shows the relative importance of the different categories of environmental properties analyzed in the Environmental Perception Questionnaire. In most of the land management systems the “Soil and Water” category is considered the most important. It is also the category that “drives” the evaluation: all the land management systems that are considered healthy overall, the “Soil and Water” category is considered “healthy” as well (see Figure 3). Among the most important environmental properties within the “Soil and Water” category, “soil erosion” is considered the most important one, especially in the forest management systems (Por_1, Por_2, Spa_2, Spa_3, see Table 3).
The Second most important category is the vegetation in all but Gre_1 and Cyp_1, where the fauna is most important. This is related with the main purpose of the land management system: animal farming.
In general, the vegetation is the environmental category to which land users have the most relation and knowledge, and within the vegetation two of the most important properties concern the vegetation diversity: “Presence of a mixture of grasses, shrubs and trees (complex vegetation structure)” and “High number of different species (vegetation diversity)”.
The categories “Soil and Water” and “Vegetation” are the most harmonized, in the sense that they are considered either healthy or degraded by a vast majority of stakeholders (cf. Figure 4). “Fauna” and “Landscape” are the categories that are less clear, in terms of degradation assessment. Overall, “Landscape” is the least important category, with the exception of Ita_1. This is probably related with the complexity of landscape processes and the difficulties in relating a specific landscape property to a certain ecosystem services or benefits.
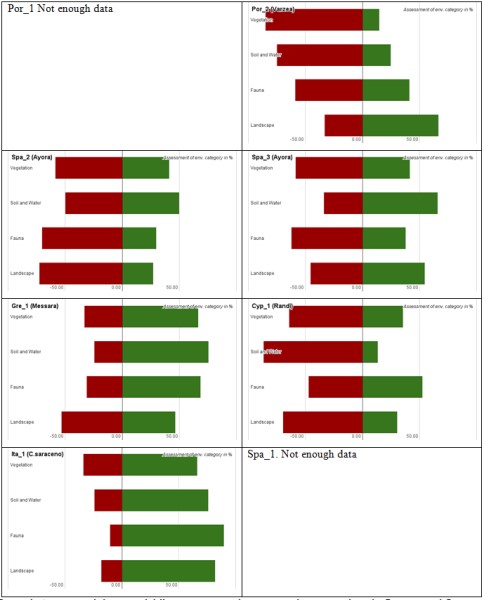
(see »Resilience Assessment Tool for the complete list of environmental properties)
Note: For full references to papers quoted in this article see