| Contributing Authors: | Matteo Jucker Riva, Gudrun Schwilch, Hanspeter Liniger |
| Editor: | Jane Brandt |
| Source document: | Jucker Riva, M., Schwilch,G., Liniger, H. 2016. A method for resilience assessment. CASCADE Project Deliverable 7.2, 61 pp |
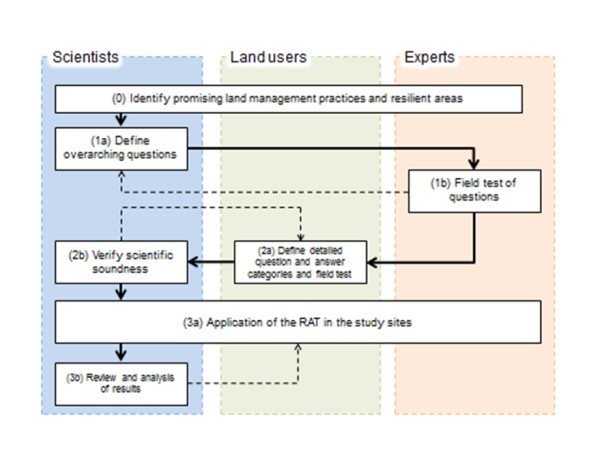
The process that lead to the Resilience Assessment Tool stemmed from the information gathered through task that »Documented and evaluated natural resource management practices, and involved several phases of testing and reviewing that are summarised in Figure 1 and explained in detailed in the following paragraphs.
1. Identification of the main scientific questions for assessing resilience
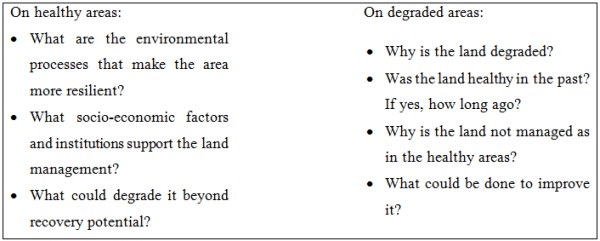
During the field visits and the contacts with stakeholders to gather »Documented and evaluated natural resource management practices, we acquired information on the processes that are relevant for the evolution of the land management system. In a first stakeholder meeting in the study sites, that served as an introduction and presentation of the project, we asked the help of stakeholders to identify “healthy” and “degraded” areas for the most common land use types. Follow-up questions during field visits with land users and managers, and semi-structured interviews with local experts and administrators, allowed us to identify relevant processes that could play a role in the resilience of the study areas (see Table 1).
The answers given by stakeholders were crosschecked with local experts, using remote sensing, and compared to various sources of scientific knowledge such as data collected on the field by project partners and previous studies on the study site areas. This work, coupled with the inventory of land management practices ( see »Documented and evaluated natural resource management practices) allowed us to identify the most relevant processes in the study sites, and lead to the main scientific questions that are at the base of the RAT (see Figure 1 phase 1a).
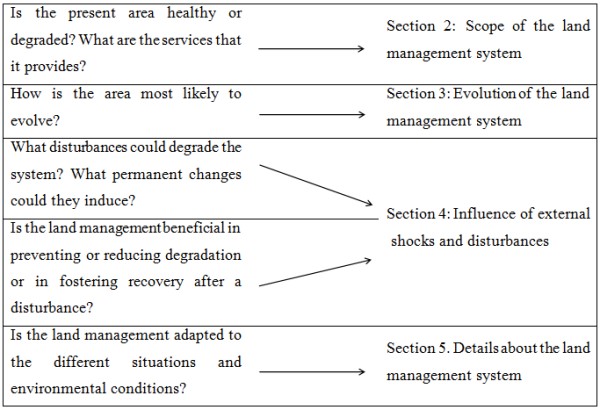
We have tested the main questions in October 2014 in Spain, during field work across a variety of different land management systems to verify the relevance of the questions and the possibility to answer them using local and expert knowledge (Figure 1 phase 1b).These main scientific questions and their relation with the sections in the RAT are presented in Table 2.
2. Design and testing of the Resilience Assessment Tool
Once the relevance of the main scientific questions was verified on the ground, we proceeded in the structuring of the assessment tool, according to the principles outlined in »Objectives of the Resilience Assessment Tool.
A draft of the RAT was tested in April 2015 in Greece with land users and local administrators, focusing on the land management practices identified in »Documented and evaluated natural resource management practices (see Figure 1, phase 2a). All the questions were submitted to interviewees as open questions; particular attention was given to verifying the understandability of the question and the validity of the categories proposed as answers.
After the testing with land users, and the consequent changes to the RAT, the tool was submitted to the scientists participating at the 2015 CASCADE project meeting (Figure 1, phase 2b). This phase served as final testing of the RAT and as training for the study-site partners. During this phase particular attention was given to ensuring that the questions were scientifically sound. Feedback from project partners was integrated in the final version of the RAT.
3. Structure of the Resilience Assessment Tool
The Resilience Assessment Tool is structured in five sections:
- Section 1 allows identifying the land management system, locating it, and sketching its major features.
- Section 2 focuses on the state of the system and the claims the land users have on the system, it includes a specific questionnaire, called “Environmental Perception Questionnaire”, that is submitted directly to land users.
- Section 3 focuses on the foreseen evolution of the system in the next 10 years, by analyzing the factors that might increase pressure, or affect management. In this section point disturbances (such as fires, floods and others, called shocks and disturbances in the RAT) are not considered.
- Section 4 then focuses on the role of shocks and disturbances, first analyzing their impact on the system, especially in relation to regime shifts, secondly by evaluating the role of land management with respect to these disturbances.
- Section 5 summarises important information about the system and details about the land management practices.
Moreover, the Resilience Assessment Tool is designed to be compatible with the WOCAT assessment method for land management technologies, both in terms of the approach to assessment and of the terminology.
The resulting type of data collected through the RAT implementation includes the following:
- Scoring/importance evaluation: Used to identify and rank the elements (e.g. demanded ecosystem services, most important environmental properties, most impacting disturbances) that are relevant to each land management system. The scoring is from 1 to 4 (less important to very important)
- Evaluation of state: the experts are asked, in consultation with stakeholders, to categorize the provision of ecosystem services and the state of different environmental properties. They can choose between ''to maintain" (thus considered healthy) or "to improve" (thus considered degraded).
- Semi quantitative evaluation of land management effectiveness: The RAT asks to evaluate benefits of land management on a scale between -4 and 4. Values below zero indicate negative impacts (i.e. decrease in resilience, increase in degradation), values above 0 a positive impact.
- Open questions: wherever possible, open questions in the form of “Specify/comment” were added to facilitate interpretation of quantitative results and to capture information that could not be categorized or quantified.
4. First application of the RAT in the CASCADE study sites
The present version of the RAT was submitted to the project partners in summer 2015, who proceeded to apply it in the study sites in autumn 2015 (see Figure 1, phase 3a). The choice of the land management system to be assessed was made by study-site partners’ team in dialogue with the CASCADE partners.
The main criteria to select the land management systems to be assessed were:
- The land use of the system is similar with the dominant land use of the study site.
- The land management system is a promising or a commonly used combination of land management practices.
The gathering of information to complete the assessment included at least one stakeholder meeting per study site, during which the EPQ (“Environmental Perception Questionnaire”, see Annex 2) was completed and, when necessary, follow up interviews with local administrators or experts were held.
The RAT was completed using a form in MS Word and a first round of data collection underwent a review to improve coherence, completeness and clarity of the information collected (Figure 1, phase 3b). For the present analysis, the final assessments from all 8 study sites were subsequently uploaded in a dedicated database on Google Drive. Results were analyzed using a spreadsheet program. The spreadsheet allows the automatic creation of a summary result page to facilitate dissemination of results and further discussion among practitioners, as shown in Annex 5.
The focus of the data analysis was to summarize the most relevant information in a semi-quantitative way, without disregarding the qualitative information. For this purpose we used the data type 1 and 2, while for the interpretation of results we relied on the open questions.
In particular, to evaluate the state of the system, the provision of ecosystem services and the future evolution of the land management system we combined the scoring (data type 1) with the state evaluation (data type 2) using the following formula:
![]()
Where nh refers to the number of elements considered “healthy” (provision of ecosystem services, state of environmental properties) or “improving” (when analyzing the future evolution of the system). Ih is the importance score of the healthy/improving elements; nT is the total number of elements considered, and IT is the sum of the importance scoring given to the elements considered. This allows condensing aspects like provision of ecosystem services and the state of the environment in a single number.
Note: For full references to papers quoted in this article see