| Main authors: | Diana Sietz, Luuk Fleskens, Lindsay C. Stringer |
| Editor: | Jane Brandt |
| Source document: | Sietz, D. et al. (2017) Report on integrated modelling strategy. CASCADE Project Deliverable 8.2 33 pp |
In this step, the ecological model outputs derived in »Step 2: Assessing ecological impacts of land management are subject to an economic analysis. For this, the modelled vegetation cover is translated to livestock productivity. The rangeland resilience model provides time series of perennial vegetation cover as an output variable describing dynamics in an ecosystem’s state. Similar to the ecological impacts, costs and benefits are assessed for yearly time steps over a 10-year period resulting in annual cash flow series, and management scenarios are compared to the baseline scenario. As a basis for the economic assessment, regional input data have been collected in an expert survey conducted with regional land users and CASCADE scientists covering all CASCADE grazing sites to support the modelling process. These include empirical factors to convert vegetation cover to biomass and data on economic costs and benefits associated with livestock management.
In linking model outputs and economic considerations, perennial vegetation cover is converted to available biomass, i.e. pasture productivity, using site-specific empirical conversion factors. For example in Castelsaraceno, Italy, the biomass conversion factor is 55kg dry matter/ha per 1% perennial vegetation and 80-98% of vegetation is palatable. This is comparable with sub-desertic steppes in North Africa where 1% perennial vegetation cover correlated with 43 ± 3.6 kg dry matter perennial phytomass/ha and 80-100 ± 25kg for alfa grass steppes only (Le Houérou 1987). The original rangeland resilience model simulated the effects of grazing on vegetation cover without considering a pasture’s grazing capacity and feedbacks on livestock productivity. Here, the model has been extended to deliver information on grazing capacity considering the empirical biomass conversion factors. This provides a necessary link to assess dynamics in livestock productivity.
Livestock is usually maintained by pasture production (available biomass) and supplementary fodder purchased on the market e.g. in winter season. The lower the pasture productivity, e.g. due to degradation, the more supplementary fodder needs to be purchased throughout the year. The sum of pasture production and supplementary fodder needs to meet the total feed requirements considering animal-specific requirements and the number of livestock grazed on a plot. Feed requirements vary with animal weight, age and activity level. These aspects remain beyond the scope of this modelling strategy to keep an appropriate balance with the level of detail captured in the management scenarios and fundamental ecological processes.
For livestock grazed on pasture land, the difference between total feed requirements and fodder available through pasture production is assumed to be purchased contributing to management costs. For livestock kept in stables, e.g. when reducing livestock pressure in normal years and resting in wet years, we assume that these animals are entirely fed on purchased fodder. The costs for fodder purchase are summed with the costs for hiring labour (e.g. livestock drover and cheese production) and other expenditures (e.g. land rent, veterinary consultation and stable construction) minus received subsidies to determine total management costs. Moreover, gross income is derived from total livestock produce (e.g. meat and wool) and the respective prices received for sale. From this gross income, management costs are subtracted to determine the net income from implementing a management strategy compared with the baseline situation. Net income dynamics are presented as annual cash flow series over 10 years (see Figure 1 for example output).
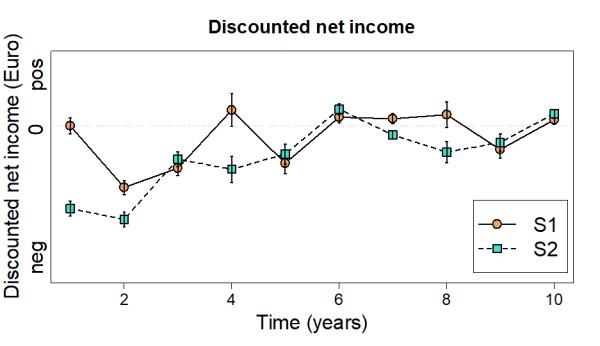
Figure 1 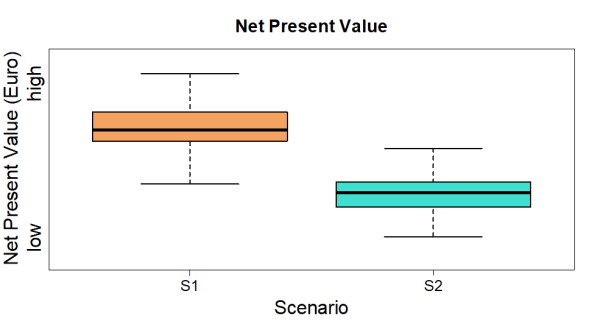
Figure 2
Finally, all cash flow series are discounted to reflect the cost of capital. This allows comparing those management strategies that require similar expenditures and are equally effective. The strategy that generates the effects earlier is clearly more attractive. The discount factor (e.g. 10%) is estimated based on the costs that are incurred when land users borrow money. This is motivated by the consideration that borrowing money to invest in land restoration should yield at least the amount borrowed plus interests and transaction costs. The sum of discounted cash flows yields net present values (NPV; see Figure 2 for example output). NPV is an appropriate economic indicator since management costs reach similar magnitudes in the scenarios considered in this modelling approach. If a management scenario results in negative NPV, it would be important to identify whether there is a discount factor at which the management becomes attractive. Corresponding to a situation in which NPV is zero, this information is expressed as internal rate of return (IRR) useful to inform financial policies on credit conditions. An additional key aspect to inform policies relates to the price of fodder that leads to a positive NPV. This is determined using a gradient of fodder price.
Note: For full references to papers quoted in this article see