| Main authors: | Diana Sietz, Luuk Fleskens, Lindsay C. Stringer |
| Editor: | Jane Brandt |
| Source document: | Sietz, D. et al. (2017) Report on integrated modelling strategy. CASCADE Project Deliverable 8.2 33 pp |
There are three major dimensions within the model that require uncertainty analysis of future outcomes of land management.
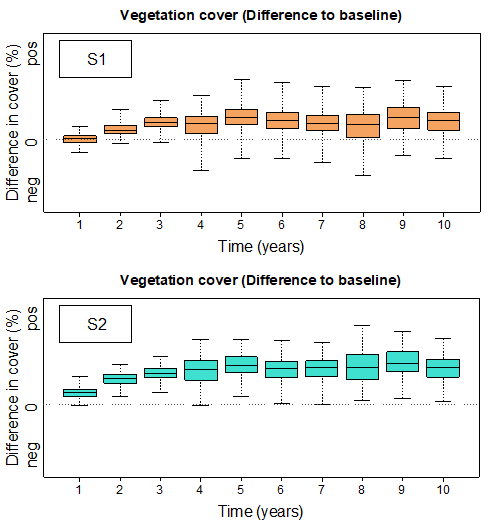
- First, the spatial vegetation structure can vary according to the initial distribution of vegetation patch size. Potential variations are captured by repeating model simulations using 200 landscapes with random initial vegetation structure.
- Second, environmental variability can trigger long-lasting changes in vegetation cover, particularly when an ecosystem is approaching a critical threshold. Variability in environmental conditions is implemented stochastically over time.
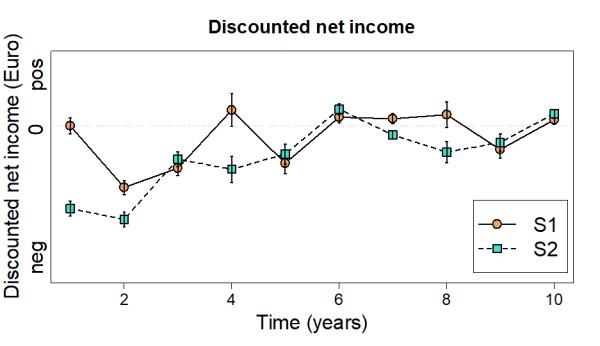
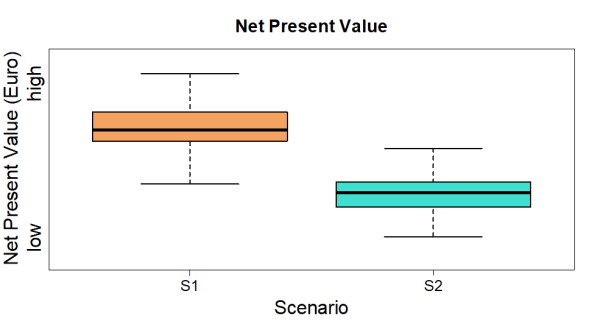
- Third, the stochasticity in vegetation structure and environmental variability implies uncertainty in discounted net income and net present value.
The resulting ecological and economic variations are quantified in three ways:
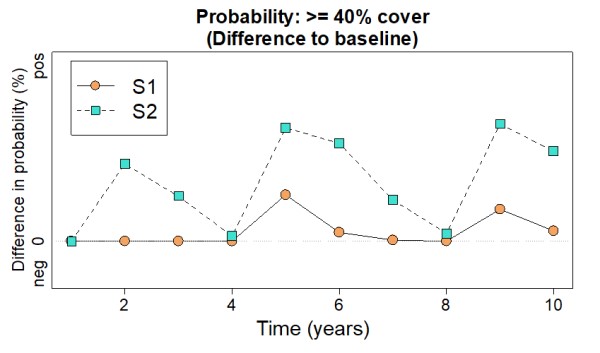
- by calculating the probability of reaching ≥40% vegetation cover (see Figure 2),
- by indicating the degree of data dispersion – graphically displayed in boxplots of vegetation cover and net present value – without making an assumption about the statistical data distribution (see Figures 1 and 4) and
- by determining the standard deviation – displayed as error bars of discounted net income (see Figure 3).

Figure 1 
Figure 2

Figure 3 
Figure 4
Taken together, the boxplots and error bars provide estimates of how future vegetation cover and income vary according to variability in vegetation structure and environmental conditions. Moreover, results may be associated with uncertainty depending on site-specific fluctuations, land users’ perceptions and memory bias in recalling expenditures. Since this modelling strategy focuses on typical land management situations to investigate principle future development trajectories, these variations remain unconsidered and may be included in an extended future assessment.
Note: These figures are also discussed in other articles. They are included here to aid reading this article.
Note: For full references to papers quoted in this article see
