| Main authors: | Diana Sietz, Luuk Fleskens, Lindsay C. Stringer |
| Editor: | Jane Brandt |
| Source document: | Sietz, D. et al. (2017) Report on integrated modelling strategy. CASCADE Project Deliverable 8.2 33 pp |
After defining the management scenarios and windows of opportunities and risks in »Step 1: Defining managment scenarios, the rangeland resilience model (Kefi et al. 2007, Schneider and Kefi 2016) needs to be parametrised. This is done in relative terms according to ecological conditions observed at the study sites in Randi Forest (Cyprus), Crete (Greece), Castelsaraceno (Italy) and Albatera (Spain) reflecting CASCADE’s potential for comparative analysis. The ecosystems at the CASCADE study sites exemplify particular environmental conditions (such as aridity and soil characteristics) and related feedback mechanisms that can be differentiated in the model simulations in a hypothetical way. Representative theoretical ecosystem properties are used to define three types of ecosystems depicting contrasting environmental conditions and vegetation states. These include
- extremely marginal environment and sparse vegetation cover,
- marginal environment and medium vegetation cover and
- better environment and higher vegetation cover.
Covering broad variations in environmental conditions and ecological feedbacks enables systematic analysis of the range and limitations of a specific management scenario to restore or maintain healthy pastures. This can improve our principle understanding of the coupled nature of pasture conditions, strategic management choices, impacts on ecosystem functioning and sustainability outcomes. The types of ecosystems represented are outlined below and summarised with the respective model parameters in Table 1.
Table 1. Types of ecosystems captured in the model simulations. (Note: All parameters are scaled to 0-1 range reflecting minimum and maximum values.)
| Type of ecosystem | Ecosystem’s properties | Model parameters | Representative study site | |||
| Environmental quality (b) | Local facilitation (f) | Local competition (c) | Associational resistance (p) | |||
| Extremely marginal environment and sparse vegetation cover | Extremely dry and very shallow/infertile soils, low facilitation and strong local competition | Very low (0.1) | Low (0.2) | High (0.8) | Very high (0.9) | Randi/Cyprus (degraded site), (Albatera/Spain*) |
| Marginal environment and medium vegetation cover | Dry and shallow/infertile soils, low-medium facilitation and medium-high competition | Low (0.3) | Low-Medium (0.4) | Medium-High (0.6) | High (0.7) | Crete/Greece, Randi Forest/Cyprus (reference site) |
| Better environment and high vegetation cover | More humid and deeper/more fertile soils, medium-high facilitation and low-medium competition | Medium (0.5) | Medium-High (0.6) | Low-Medium (0.4) | Medium (0.5) | Castelsaraceno/Italy |
* The study site in Albatera, Spain is hardly grazed anymore due to severe degradation of vegetation and soils.
Extremely marginal and sparse vegetation cover:
- This ecosystem type is assumed to display very marginal environmental conditions such as extreme water scarcity and shallow soils. In these harsh dryland conditions, local facilitation, associational resistance and strong local competition are considered important factors affecting vegetation dynamics (Kefi et al. 2007). Local facilitation means that plants accumulate organic matter, provide shade and retain water, improving growing conditions and support other plants’ recruitment in their vicinity. Along a gradient of low to high rainfall in semi-arid ecosystems, field studies have shown shifts from competition to facilitation and back to competition (Maestre and Cortina 2004, Maestre et al. 2005). Therefore, high local competition and low facilitation are assumed for this ecosystem type. Moreover, associational resistance refers to the joint protection when plants grow in patches decreasing the chance of being grazed by livestock (Schneider and Kefi 2016). It is particularly important in sparsely vegetated landscapes. The strongly degraded study sites in Randi, Cyprus and Albatera, Spain depict high aridity (Trabucco and Zomer 2008), shallow soils and very low vegetation cover due to overgrazing (see »Restoration potential for preventing and reversing regime shifts) providing empirical support for these conditions.
Marginal and medium vegetation cover:
- In this type of ecosystem, environmental conditions are still considered to be marginal, including low precipitation and eroded soils, but more favourable than in the previous ecosystem type. The slightly more favourable environment is supposed to support intermediate vegetation coverage. Hence, ecological feedbacks related to local facilitation are assumed more important, while local competition and associational resistance are considered less important for vegetation dynamics than in the previous ecosystem type (Maestre and Cortina 2004, Maestre et al. 2005). These circumstances represent core ecosystem properties and feedbacks observed at the study site in Messara, Greece where aridity, water overuse and partial overgrazing have led to land degradation including reduced vegetation cover (Trabucco and Zomer 2008, see »Restoration potential for preventing and reversing regime shifts).
Better environment and higher vegetation cover:
- This type of ecosystem is considered to represent better environmental conditions including higher humidity and more favourable soil properties that support higher vegetation cover in the absence of livestock grazing. Yet in more densely vegetated landscapes, plant recruitment is assumed to depend to a greater extent on facilitation and less on competition for limited resources (Maestre and Cortina 2004, Maestre et al. 2005, Kefi et al. 2007) and associational resistance than in the previous ecosystem types. The more humid and more densely vegetated study site in Castelsaraceno, Italy (Trabucco and Zomer 2008, see »Restoration potential for preventing and reversing regime shifts) reflects major aspects of these circumstances.
The model is parametrised using a 0-1 parameter scale enabling comparability across study sites. This allows us to qualitatively discuss the effects of parameter changes in relation to minimum and maximum values which may useful to frame policy recommendations or explore the impacts of future development scenarios. For example, we may explore in which situation a certain EU policy might provoke most change in relative terms. However, a given parameter value can have very different real-world values across the study sites meaning that a large relative change may mean only a small (absolute) change in real world processes and outcomes. This needs to be taken into account when evaluating the model results.
To finalise the model parametrisation, the livestock density parameter is chosen in such a way that the modelled vegetation cover corresponds to the observed perennial vegetation cover (data collected in regional survey) reflecting distinct degradation levels in each study site (e.g. reference and degraded sites). The actual livestock density and share of palatable vegetation are then used to estimate site-specific conversion factors for observed and modelled livestock density assuming that 1 livestock unit (LU) corresponds to 1 cattle, 6 sheep and 4 goats.
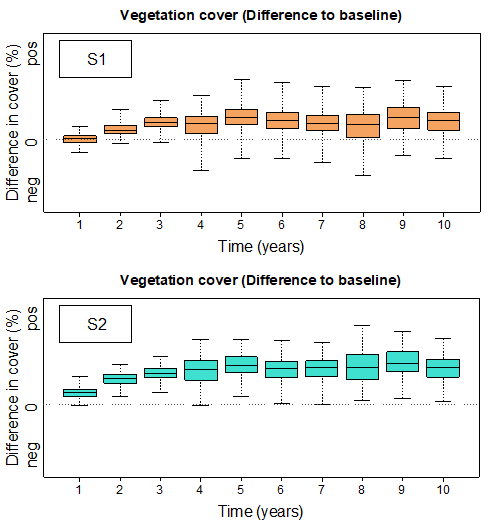
Figure 1 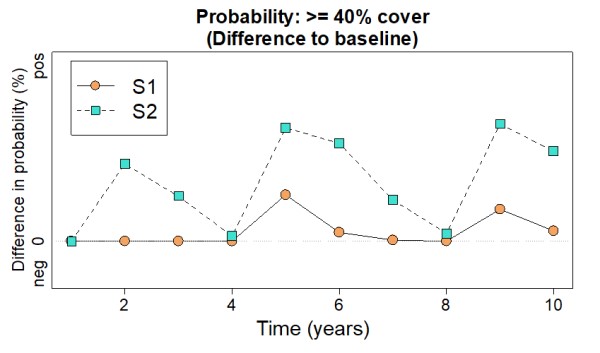
Figure 2
Based on this parametrisation, the rangeland resilience model is used to simulate vegetation cover dynamics for the various management scenarios including two stochastic dry and wet years to simulate the effects of extreme environmental conditions. Simulations are performed separately for each management strategy using the same environmental conditions (e.g. precipitation and soil depth) and all results need to be compared with the baseline situation. These model simulations provide time series of ecological management impacts without yet capturing any socio-economic impact. The timing of ecological effects is important in the economic evaluation conducted in »Step 3: Estimating economic impacts of land management. Step 2 generates vegetation cover dynamics with annual resolution for time series of 10 years (see example output in Figure 1). Evaluation of ecological management impacts include critical levels of vegetation cover (probability ≥40%; see example output in Figure 2) as defined in »Guidelines for natural resource managers, reversibility of degradation and potential restoration/degradation shifts.
Note: For full references to papers quoted in this article see