| Authors: | Alejandro Valdecantos and Ramón Vallejo (CEAM) with input from study sites |
| Editor: | Jane Brandt |
| Source document: | Valdecantos & Vallejo. (2015) Report on structural and functional changes associated to regime shifts in Mediterranean dryland ecosystems. CASCADE Project Deliverable 5.1. |
An area under pressure from grazing
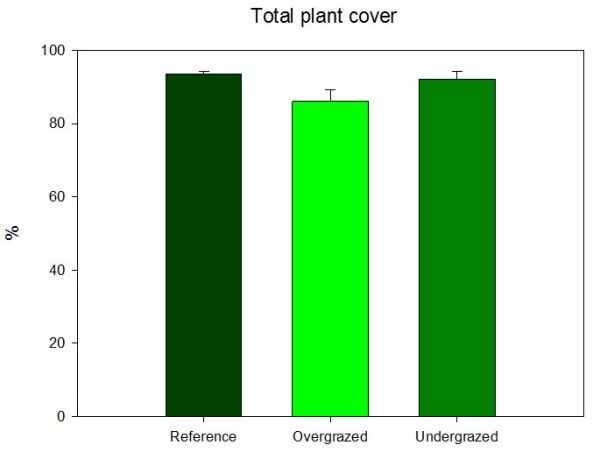
Plant cover was very high in all three different ecosystem states in Castelsaraceno field sites. Both the Reference and the Undergrazed communities showed total plant cover percentages above 90%, while the average of this value was 86.1 % in the overgrazed plots. The most characteristic species in the Reference were Scorzonera villosa, Botrhiocloa ischamum and Brachypodium rupestre (12.8, 11.9 and 10.5%, respectively). The Overgrazed areas also showed high cover of S. villosa and Stipa austroitalica (12.1 and 10.8%, respectively), while the Undergrazed sites showed the most different species abundance. Spartium junceum, a legume shrub, and B. rupestre were the most abundant species in these areas, with 41.3 and 38.2% total cover, respectively. This is the only situation in which a shrub became the most represented species in the whole Castelsaraceno field site. Poaceae is the family that presented higher number of different species and cumulative cover in the Reference (15 species, 66.0%), Overgrazed (13 sp, 60.2%) and Undergrazed states (13 sp, 73.3%). Species of Fabaceae contributed with 46.3% to total plant cover in the Undergrazed, mostly due to S. junceum, 16.9% in the Reference and 14.8% in the Overgrazed.
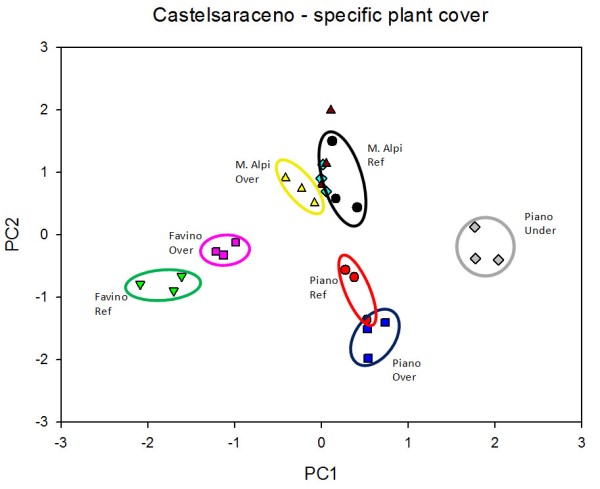
In Castelsaraceno we found a marked effect of the three spatially replicated sites on plant cover and community composition. In Piano del Campi, plots showed positive values of PCA first axis and negative ones of the second axis, in Monte Alpi values of PC1 were close to 0 and positive in PC2, and in Favino both axis showed negative values except for the three undergrazed replicates. Species with higher eigenvalues on axis 1 are Micromeria graeca, Stipa austroitalica, Linum tryginum, Triticum ovatum and Sanguisorba minor (values 0.595, 0.573, 0.541, 0.524 and 0.508, respectively). Medicago minima, Capsella bursa-pastoris, Agropyron repens, Trifolium repens, Hordeum murinum and Holcus lanatus are negatively extracted on the first axis (-0.814, -0.714, -0.705, -0.655, -0.624 and -0.618, respectively). On the second axis, Triticum ovatum, Scorzonera villosa, and Botrhiochloa ischamum were associated to negative values (-0.733, -0.719 and -0.655, respectively, while Brachypodium rupestre showed the highest positive weight (0.784). According to the main effects of pressure, no major distinctions between the three levels were observed.
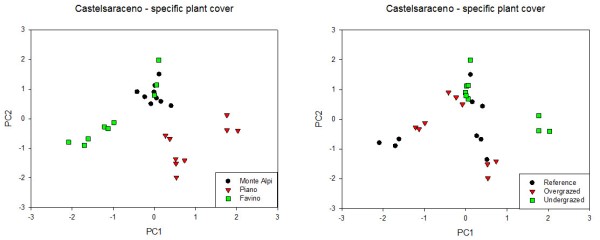
However, plots showed differences due to degradation within each spatial replicate. In general, the Overgrazed plots were more similar to the References in composition and cover than the Undergrazed plots. Both in Favino and Piano del Campi, the Undergrazed plots had higher values of axis 1 than the Reference and Overgrazed ones. Lower differences between those two were observed in the second axis values. All nine plots in Monte Alpi were very close but grouped by degradation pressure. The first two axis of the PCA analysis on specific plant cover explained only 20% of the total variance but it is noteworthy that it included all species present in any of the 27 evaluation plots (126 species).
Overgrazing resulted in a not significant decrease of total aboveground biomass, from 7.78 Mg ha-¹ in the Reference to 5.50 Mg ha-¹. Overgrazed areas showed a reduction of 23% in biomass of grasses but also a 54% reduction in shrub biomass. Removing grazing implied a significant recovery of the biomass of the plant community (F=8.522, p=0.002) mostly due to shrub biomass build up. Shrub biomass in the Reference systems averaged 1.6 Mg ha-¹ while in the Undergrazed lands it was above 12 Mg ha-¹ (F=8.932, p=0.001). Changes in grass biomass were not so pronounced, from 6.2 Mg ha-¹ in the Reference to 7.3 Mg ha-¹ in the Undergrazed (F=1.595, p=0.224).
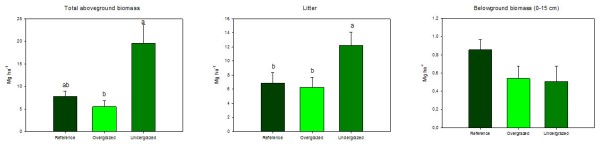
Litter accumulation on the Reference and Overgrazed areas was very similar (around 6.5 Mg ha-¹) while in the Undergrazed sites this amount significantly increased to twice those values (F=4.003, p=0.032). But belowground biomass in the uppermost 15 cm showed a trend to decrease from the Reference to both types of pressure in a similar way.
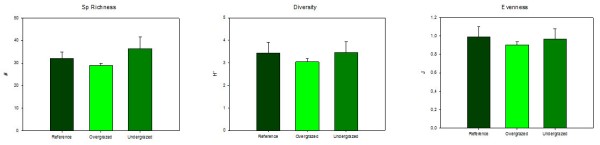
The three diversity indexes we evaluated (species richness, diversity, evenness) did not show significant changes in relation to the degradation state in Castelsaraceno. Number of plant species was highest in the Undergrazed plots and lowest in the Overgrazed ones (36 and 29, respectively). Reference areas showed intermediate number of species richness. Something similar was observed both in Shannon’s diversity index and Evenness with all three communities showing very close figures. It does not seem that either over- or undergrazing had important impacts on plant diversity.
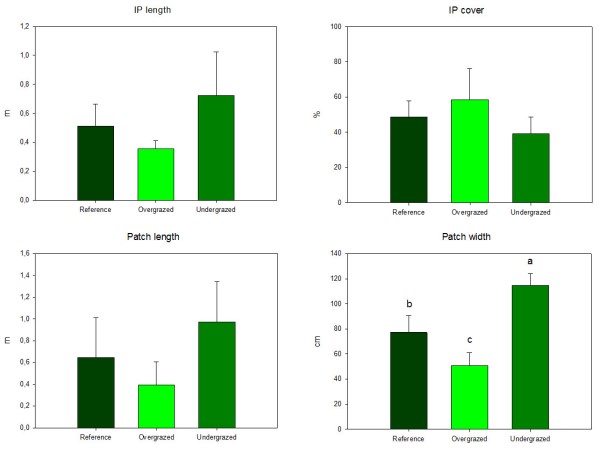
Interpatches in the Castelsaraceno field site are not bare soil areas but pieces of land covered mostly by small isolated annuals, with perennials or not, but without forming clumps. Patches included compact vegetated spots with shrubs, perennials and/or annuals.
Regarding the spatial distribution of vegetation, over- and undergrazed areas showed the opposite arrangement of interpatches. IP in the Overgrazed state were shorter than in the Undergrazed (35 vs 72 cm, respectively) but a higher proportion of the landscape was due to IP (58.4 and 39.2% in Over- and Undergrazed, respectively). Average size of vegetated patches was also higher both in length and width in the Undergrazed than in the Overgrazed sites, suggesting a higher concentration of vegetation when grazing reduced.
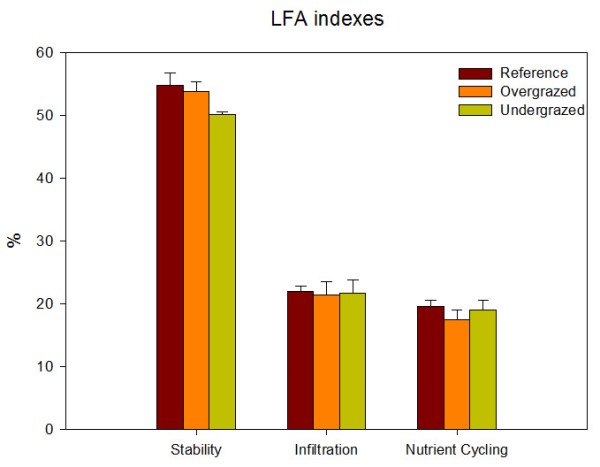
From the point of view of ecosystem functioning, the three states of pressure showed very similar results in the three indexes derived from the LFA assessment. The biggest change was observed in the Stability index that reduced from 54.9% in the Reference to 50.1% in the Undergrazed. However, none of the changes on those indexes were statistically significant.
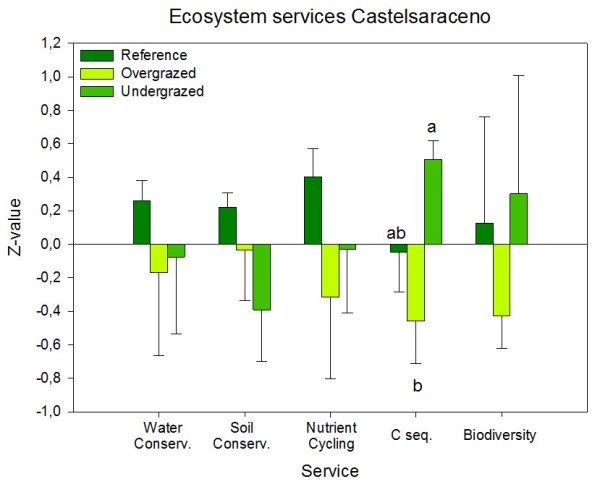
Soil and water conservation and nutrient cycling are the three services that showed a trend to decrease as affected by over- and undergrazing. However, variability was very high and prevented significant differences. On the other hand, C sequestration was significantly improved in the Undergrazed sites, especially when compared with Overgrazed areas. In general, environmental ecosystem services were reduced in the Overgrazed plots in relation to the Reference while the Undergrazed showed intermediate overall loss of services.
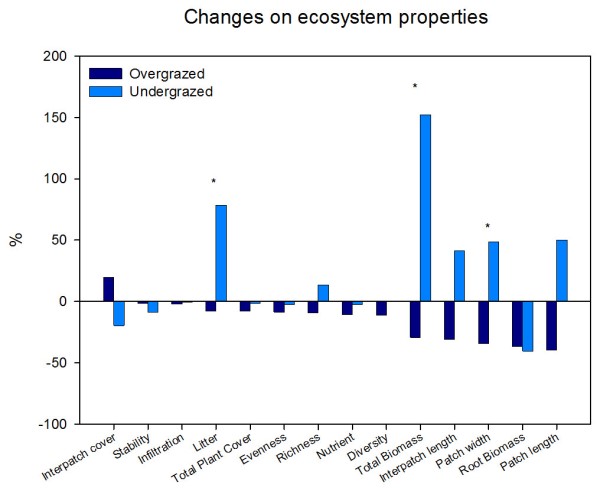
The two degraded states of the ecosystem in Castelsaraceno field site showed the opposite changes in the ecological variables assessed. All variables showed losses in the Overgrazed in relation to the References, especially the width of vegetated patches and total aboveground biomass. Reductions in the length of interpatches can be seen as a positive change. On the other hand, Undergrazed sites showed gains in all properties, especially in total aboveground biomass, litter accumulation and the size of vegetated patches.
Note: For an overview of the structural and functional changes and their analysis in all study sites see »Structural and functional changes.