| Authors: | Alejandro Valdecantos (CEAM),V. Ramón Vallejo (UB), Susana Bautista (UA), Matthijs Boeschoten (UU), Michalakis Christoforou (CUT), Ioannis N. Daliakopoulos (TUC), Oscar González-Pelayo (UAVR), Lorena Guixot (UA), J. Jacob Keizer (UAVR), Ioanna Panagea (TUC), Gianni Quaranta (UNIBAS), Rosana Salvia (UNIBAS), Víctor Santana (UAVR), Dimitris Tsaltas (CUT), Ioannis K. Tsanis (TUC) |
| Editor: | Jane Brandt |
| Source document: | Valdecantos, A. et al. (2016) Report on the restoration potential for preventing and reversing regime shifts. CASCADE Project Deliverable 5.2 104 pp |
- The composition of the plant community of areas subjected to Traditional and, especially, Conservation logging is closer to the Reference than the Degraded areas
- The disposal of plant remains on the soil surface after wood removal increased the cover and size of patches and, hence, the conservation of resources
- However, plant remains on soil might hamper the recruitment of some species, especially seeders, with direct consequences of diversity indexes and biomass build up
- Ecosystem functioning assessed as LFA’s stability, infiltration and nutrient cycling indexes were improved by the restoration approaches but are still far from the natural forest
- In general, restoration actions improved ecosystem properties and services at the very short term after their implementation although the dynamics of the plant communities were slowdown, probably due to the impact of the heavy machinery on the earliest regenerated plants
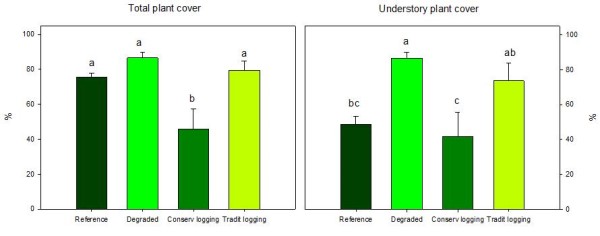
The two post-fire approaches considered showed significant differences in total plant cover assessed three years after the fire (Figure 1 left). Traditional logging (79.6%) improved plant cover in relation to conservation logging (45.8%) that left wood remains piled on the ground in lines. The degraded area, where no action was conducted after the last fire, and the reference unburned forest showed values of plant cover similar to the traditional logging. Most of the total cover of the Degraded and Restored areas was due to species of the understory while pine cover was above 70% in the Reference forest. As a consequence, the cover of the understory in the Reference fell below 50%, significantly lower than the four-time burned area (Figure 1 right).
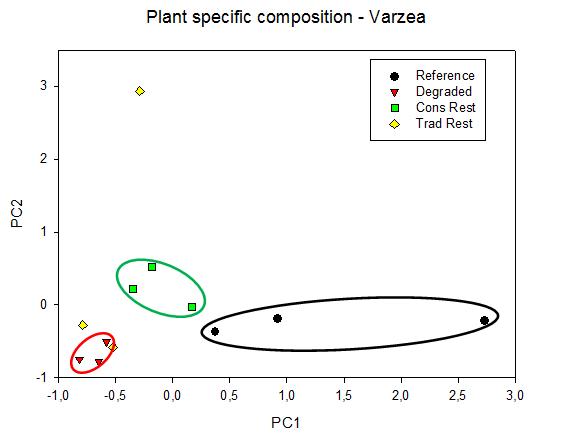
Although there were not many differences in total plant cover between the Reference and the other states of the ecosystem, the composition of species was rather contrasted. Pinus pinaster is the most abundant species in the unburned forest (68.7%) followed by Agrostis curtisii and Ulex minor (18.4 and 15.9%, respectively). The three most represented species in the Degraded areas three years after the fire were A. curtisii (56.2%), Pterospartum tridentatum (38.8%) and Erica umbellata (27.4%). Two species showed cover values above 10% both in the Conservation and Traditional Logging areas but with contrasted percentages. Agrostis curtisii was much more abundant in the Traditional than in the Conservation site (54.2 vs 21.9%) while P. tridentatum showed similar percentages in both areas (17.4 and 15.9%, respectively). Pine regeneration was also higher in the Taditional than in the Conservation treatment (8.0 vs 4.5%). These contrasted specific plant covers resulted in a clear separation of the plots regarding their state. The first and second axis of the PCA conducted on plant specific composition explained 28.1 and 21.9% of the total variance, respectively (50.0% of accumulated explained variance). The first component clearly separated the Reference from the rest of the plots along the first component (Figure 2). The species with highest positive weight in PC1 were Ulex minor (eigenvalue 0.911), Pteridium aquilinum (0.881), and the overstory species Quercus robur (0.859) and P. pinaster (0.819), while A. curtisii was negatively extracted on this axis (-0.712). The Degraded and Conservation Restoration areas were separated along both the first and the second axis. The species with highest positive weight on the second axis are Halimium laisanthum (0.948), Erica cinerea (0.925) and Agrostis delicatula (0.925). The areas subjected to Traditional Restoration showed high variability within the group and were plotted in a wide range of values of the second axis but in a very narrow range of the first axis.
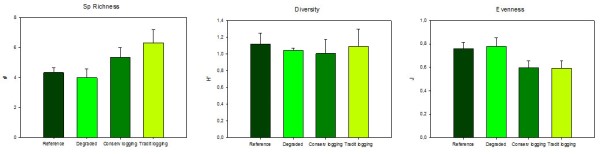
None of the diversity indexes assessed showed significant differences between the four states of the ecosystem (Figure 3). The total number of plant species recorded was very low with a slight trend to increase in the Restored areas in relation to both the Degraded and the Reference plots. Conversely, evenness was slightly lower in the Restored states than in the Reference and Degraded plots, falling from 0.78 to 0.59. The Shannon-Wiener index was quite similar in all four states of the ecosystem.
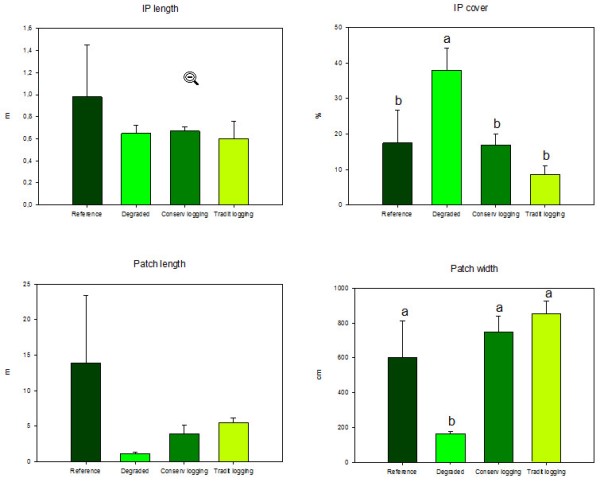
The two restoration approaches significantly reduced the cover of interpatches from 38.0 to 16.8 and 8.6% in the Conservation and Traditional Logging, respectively (Figure 4). In addition, the quality of these interpatches also differed in the four ecosystem states; pine needles in the unburned, plant remains in the logged, and bare soil and ashes in the degraded. The size of the patches was also increased in the two Restored areas in relation to the Degraded area, increasing significantly the width 4.7 and 5.3 times in the Conservation and Traditional Logging, respectively. The patches showed also a trend to be longer in the two Restored than in the Degraded areas but differences were not statistically significant. In addition, the typology of the patches was also contrasted. In the Degraded state patches consisted mainly in plants while litter and remains of wood extraction after the fire were the main patches in the two Restored areas. All four variables related to patch and interpatch characteristics in the Reference forest were not different than in the Restored areas.
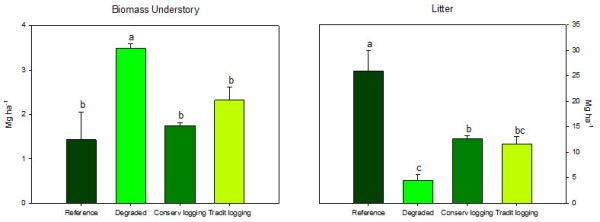
The highest total biomass of the ecosystem was of course observed in the Reference unburned forest but the biomass of the understory component, both woody and grasses, was significantly higher in the Degraded than in the other three states of the ecosystem (Figure 5). The two restoration approaches required the participation of heavy machinery in the site impacting the recovery and the build up of vegetation biomass. These restored areas, specially the Conservation Logging, showed significant higher litter accumulation than in the Degraded, mainly due to the disposal of plant remains during wood extraction after the fire. Litter in the Restored areas represented 5 and 7 times the total standing plant biomass while in the Degraded this ratio was only 1.3. The two restoration approaches were highly efficient in protecting the soil surface with the remains of the extracted plants. The percentage of bare soil was around 5% in the two Restored areas as compared to 31% of exposed soil surface in the Degraded. Reference plots showed only 1% of unprotected soil surface.
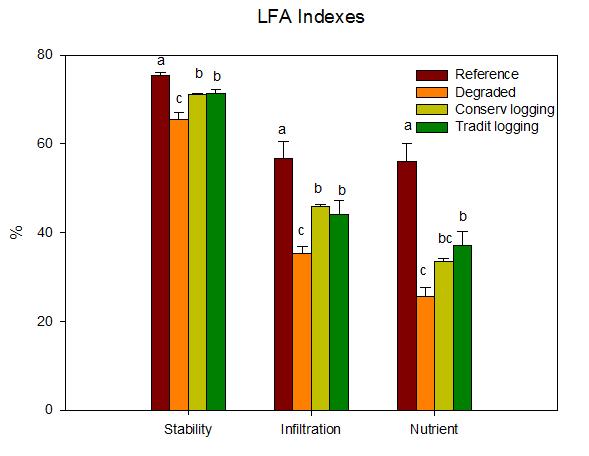
The three indexes of functionality of the ecosystem derived from the LFA assessment were similar in the two alternative Restored sites but were significantly improved from the Degraded situation (Figure 6). The Stability, Infiltration and Nutrient Cycling indexes increased in a 9%, 30% and 45%, respectively, in the best of the Restored options as compared to the Degraded state. However, all indexes are still far from the values of the Reference forest.
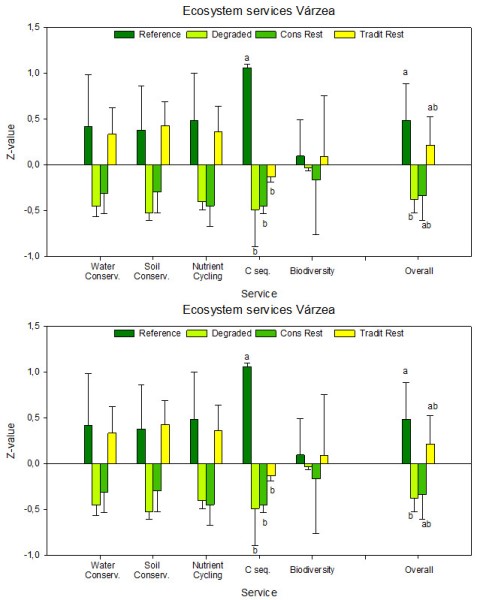
The calculation of the five ecosystem services considered showed significant differences only in C sequestration and in the combination of all five services (Figure 7). The Conservation Restoration released very similar results than the Degraded plots while the Traditional Restoration showed a trend to increase all services from these two situations. Absolute values of Water and Soil Conservation, Nutrient Cycling and Biodiversity in the Traditional Restored sites were quite similar to the Reference forest.
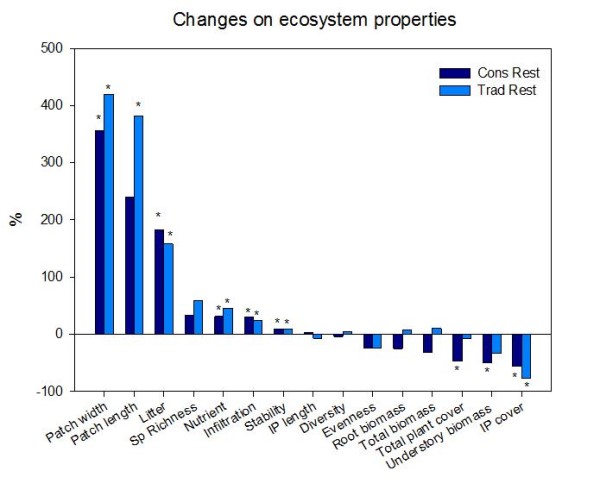
Nine out of fifteen ecosystem properties considered in this assessment changed in one or the two Restored areas in relation to the Degraded four-times-burned sites (Figure 8). Only total plant cover and understory biomass worsened in the Conservation Restoration respect the Degraded. Properties related to the organization of the landscape, such as patch width and length and interpatch cover, released the greater changes. Significant negative changes in Interpatch cover might be interpreted as an improvement of ecosystem functioning. Also the three LFA derived indexes were significantly improved with both Restoration approaches. These findings suggest that actions carried out after the fire improved the ability of the ecosystem to retain resources in situ and, hence, the functionality of the system.
Note: For full references to papers quoted in this article see