| Main authors: | Bautista, S., Urghege, A.M., Camacho, A., Turrión, D., Jaime, L., Vera, M.A., Nazarova, V., Vega-Rosete, S., Sáez-Cases, A., Fuster, A., Morcillo, L., López-Poma, R., Valera, M., D. Fuentes, and Rodríguez, F., Bladé, C. and Mayor, A.G. |
| Editor: | Jane Brandt |
| Source document: | Bautista, S. et al. (2017) Dryland restoration dynamics and thresholds as a function of plant pattern and diversity. CASCADE Project Deliverable 4.3 31 pp |
Graphs representing equilibrium vegetation values in relation to the potential plant establishment (parameter b; see »Modelling the role of ecohydrological feedbacks on degradation reversal), representing the external pressure on the system) allow analyzing the effects of the global and local feedbacks on the recovery potential of the system (Figure 1). For fixed values of the rest of the parameters of the model (mortality, competition, etc.; see details in Kefi et al. 2007b), the light brown shaded area in the graph (nra) defines the region where no recovery is possible, so that ra=1-nra (green shaded region) is an integrated measure of the recovery potential of the system.
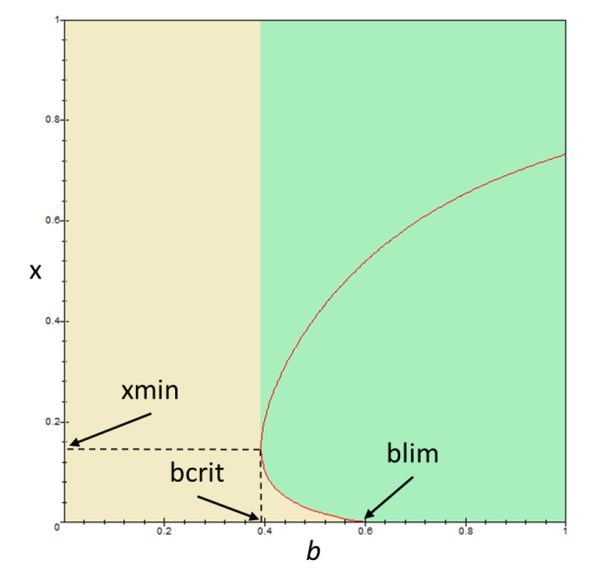
Figure 1
The minimum b value for which there is positive equilibrium vegetation (bcrit) informs about the harshest conditions that allow maintaining vegetation, while the value of vegetation cover for bcrit (xmin) indicates the minimum vegetation cover that can be in stable equilibrium in the system. The intersection of the graph with the horizontal axis (blim; blim=1 if there is no intersection) defines the upper limit of the range of external conditions that lead to bi-stability of the system (interval of b values from bcrit to blim). In this region, the system will end in the desert state when the initial cover is in the yellow shaded region, and it will recover to stable vegetated state if the initial cover is above the section of the graph separating the yellow and green areas (which constitutes an unstable equilibrium). In the cases where blim=1, the equilibrium cover value at this point indicates the minimum initial cover required for the system to recover under the best external conditions.
Figure 2 illustrates the effects of the global feedback (decreasing vegetation cover → increasing global resource loss from the system → decreasing vegetation cover) and the local feedback (decreasing vegetation cover → increasing runon-driven inputs to plant patches → increasing vegetation growth and cover) on the indicators of recovery of the system. In Figure 2 left, in the absence of local feedback (γ=0), the effect of different intensities of the global feedback is shown. When this intensity increases (increasing values of α), the regeneration capacity of the system worsens, with small increases of bcrit and xmin, and a decrease of ra. The most significant effect is the increase in the minimum vegetation cover needed to achieve regeneration in the bi-stability region, i.e., for conditions where the system can result in either a deserted or a vegetated stable state.
In Figure 2 right, the effect of different intensities of the local feedback, in the presence of a moderate global feedback (α=0.5), is illustrated. When the intensity of the local feedback increases (increasing values of γ), the general recovery potential of the system improves, but in this case the most significant effect is the possibility of stable vegetated states with much more harsher conditions (lower b values, with a significant reduction in bcrit) and with much lower vegetation cover values (with a significant reduction in xmin).
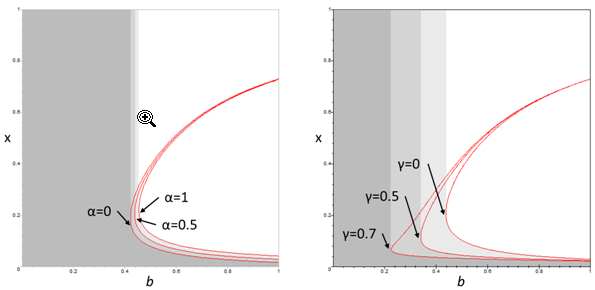
Figure 2
As expected, higher strength of the positive global ecohydrological feedback reduces the recovery potential of dryland ecosystems. Conversely, higher strength of negative local ecohydrological feedback increases the recovery potential of dryland ecosystems. However, the effect of both feedbacks is not symmetric. Variations in the negative local feedback have much larger influence in the recovery potential of the system than variations in the strength of the global feedback, being able to largely reduce the area (grey zone in Figure 15) for which recovery is not possible, and allowing equilibrium vegetation with very low cover values. This result is in agreement with some of the results from the manipulative experiments reported above, which did not find any constraining effect of low initial plant cover on the dynamics of the experimental communities established.
As both global feedback and local feedback depend on vegetation cover, the challenge would be to increase the local feedback while not increasing the global feedback The local feedback could be strengthened by creating plant patches with species or combination of species that combine deep rooting traits and a morphology that facilitates trapping runon water. This way, the capture and deep infiltration of the extra runoff water generated in large bare-soil areas is maximized (Mayor et al., 2009), which in turn would enhance plant growth.
Note: For full references to papers quoted in this article see