| Authors: | Alejandro Valdecantos and Ramón Vallejo (CEAM) with input from study sites |
| Editor: | Jane Brandt |
| Source document: | Valdecantos & Vallejo. (2015) Report on structural and functional changes associated to regime shifts in Mediterranean dryland ecosystems. CASCADE Project Deliverable 5.1. |
An area under pressure from fire
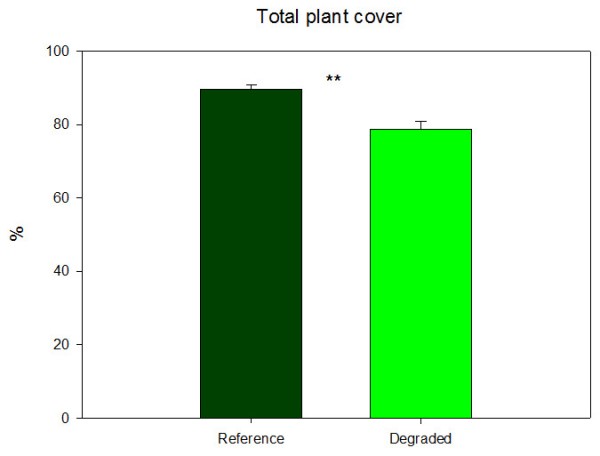
Total plant cover in Ayora has been reduced by more than 10% from the reference pine forest to the secondary mature shrubland (89.6 and 78.8%, respectively). The Reference plots are characterized by a mature overstory of maritime pine (Pinus pinaster, 47.9%) and, in a lesser extent, Aleppo pine (P. halepensis, 11.4%) and an understory dominated by Rosmarinus officinalis (26.4%), Ulex parviflorus (13.3%) and grasses (especially Brachypodium spp, 14.6%).The degraded community is a shrubland dominated by R. officinalis (44.3%) and Erica multiflora (15.7%), with an herbaceous layer with Brachypodium spp (22.0%) and Helichtotrichon filifolium (10.8%). Only 19 out of the 41 species found are common in the Reference and the Degraded states.
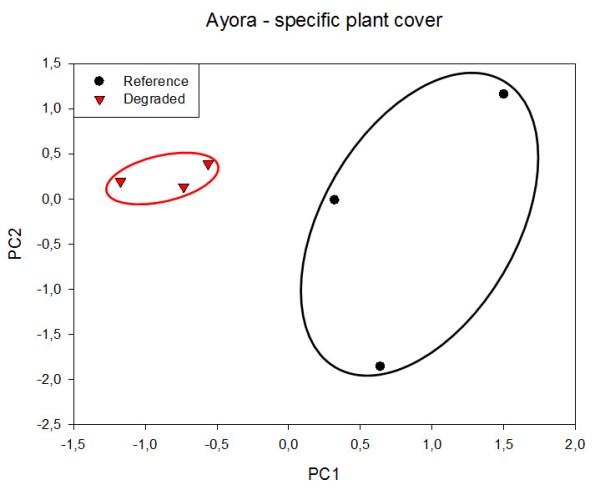
PCA analysis of specific plant cover data separated the Reference and the Degraded plots based on the values obtained on the first axis. The unburned Reference plots showed positive values on the first axis and the burned Degraded plots showed negative values. Pinus pinaster and Juniperus phoenicea are the species with higher positive weight on axis 1 (eigenvalues 0.914 and 0.804, respectively) and, hence, characteristics of the References while the shrub Quercus coccifera and the grasses Carex humilis, Helichtotrichon filifolium and Brachypodium retusum were negatively extracted on the second axis (-0.811, -0.789, -0.787 and -0.756, respectively) and abundant on the Degraded plots. The References sites showed higher variability of composition than the Degraded ones, which were much closer to each other in the PCA graph.
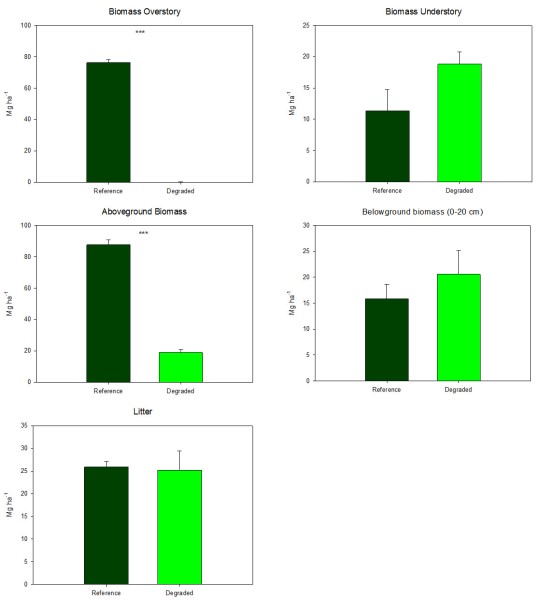
The highest contrast between biomass fractions of the ecosystem was observed in tree canopy biomass as the Degraded plots showed almost no tree recovery after fire. Biomass of the understory layer was 40% higher in the Degraded sites than in the Reference but differences were not significant (t=1.915, p=0.128). Rosmarinus officinalis was the species of the undestory that showed the highest biomass accumulation in the Reference plots (6.9 Mg ha-¹), with less than 10% of this biomass as dead material. The second species with higher biomass was Ulex parviflorus with 3.0 Mg ha-¹, 50% of it as necromass. The same two species accumulated the highest amount of biomass in the Degraded communities; rosemary has a biomass of 14.0 Mg ha-¹, in this case with less than 5% as dead biomass, and gorse presented 2.7 Mg ha-¹ but 76% of it as dead material conferring a high fire risk to the degraded community. Due to the important component of the overstory on the total biomass of the ecosystem, significant differences were observed in this variable (87.6 and 18.9 Mg ha-¹, in the Reference and Degraded sites, respectively; t=-18.013, p<0.001). Root biomass showed the same trend as the understory biomass, with a not significant increase in the Degraded in relation to the Reference plots. Litter accumulation was very similar in both states of the ecosystem (≈ 25 Mg ha-¹), though composition was different (data not shown).
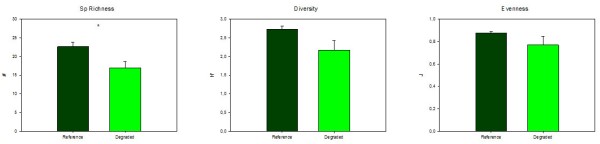
The three diversity indices (species richness, diversity, evenness) decreased in the Degraded sites in relation to the Reference ones but only the total number of plant species showed significant differences (t=-2.688, p=0.055). Shannon’s diversity index and evenness also showed reductions in the Degraded plots but differences were not significant statistically (t=-1.968, p=0.120 and t=-1.195, p=0.298, respectively).
In Ayora the interpatches included bare soil but also the herbaceous matrix and litter, very abundant in the two levels of pressure as commented above.
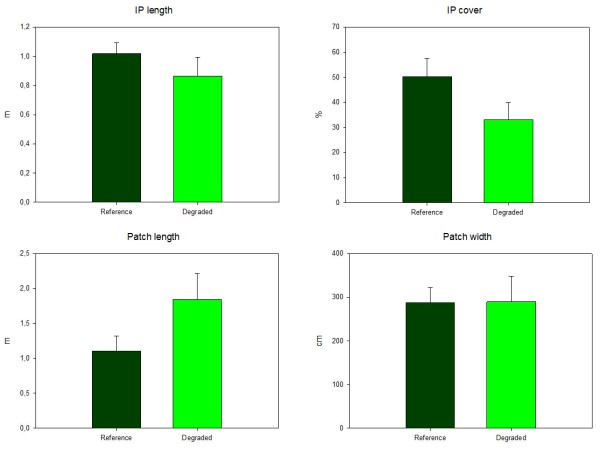
The proportion of land considered Interpatch was higher in the Reference state than in the Degraded (50.3 vs 33.1%, respectively) but differences were not significant. A similar trend was observed in the average length of the interpatches, which was slightly higher in the Reference than in the Degraded. Vegetated patches showed similar width (≈ 2.9 m) but different length, higher in the Degraded than in the Reference (1.8 vs 1.1 m, respectively). This is a consequence of the huge continuity of the mature secondary shrubland of the Degraded plots. However, none of these variables showed significant differences between ecosystem states.
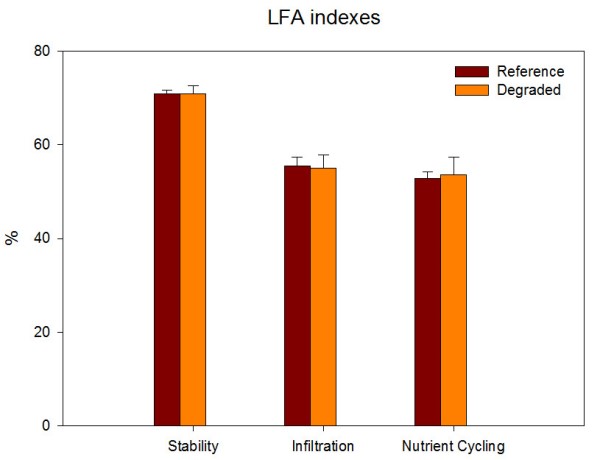
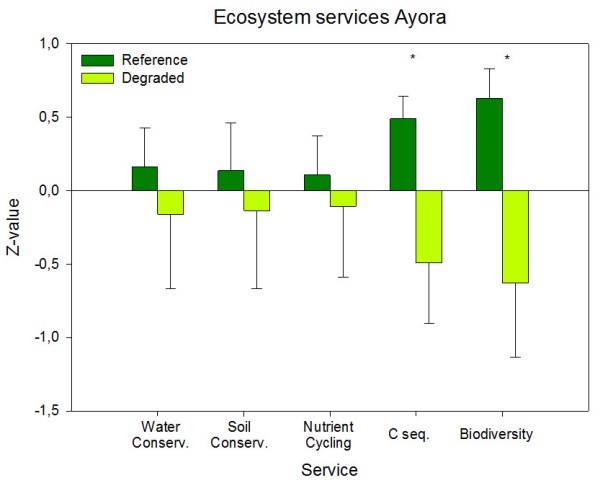
The three ecosystem function indices derived from LFA assessment showed very similar values in both states. Stability was around 71%, infiltration 55% and nutrient cycling 53% both in the Reference and Degraded ecosystems. As a consequence, the services with high weight of these indices (Water and Soil conservation and Nutrient cycling) did not show significant losses in the Degraded burned sites. Nevertheless, all these services were slightly lower in the Degraded than in the Reference. The largest loss of ecosystem services were recorded in C sequestration and Biodiversity (t=-2.206, p=0.092; and t=-2.311, p=0.082, respectively). The loss of the tree layer by the fire and the small recovery of pine species are responsible for this lower amount of C stored in the ecosystem. The lower percentage of interpatches and their smaller size in the Degraded than in the Reference sites could have affected the diversity indices and, hence, the biodiversity service. In Ayora field site, the mature secondary shrubland developed more than thirty years after the fire did not show a global loss of the assessed ecosystem services as compared to the Reference pine forest.
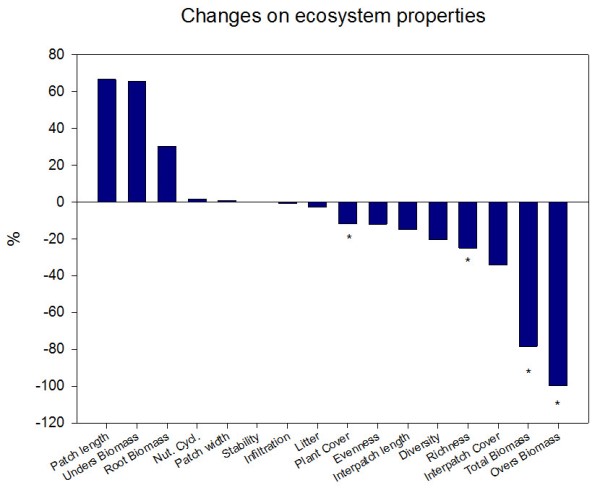
The summary of the ecological variables evaluated in this study shows a 60% increase in the length of the patches of shrubs in the Degraded plots as well as in the biomass of the understory layer. The highest loss of ecosystem properties was found in the biomass of the overstory, as pines did not recover after the fire in the Degraded sites, and, as a consequence, in total aboveground biomass.
Note: For an overview of the structural and functional changes and their analysis in all study sites see »Structural and functional changes.