| Authors: | Alejandro Valdecantos and Ramón Vallejo (CEAM) with input from study sites |
| Editor: | Jane Brandt |
| Source document: | Valdecantos & Vallejo. (2015) Report on structural and functional changes associated to regime shifts in Mediterranean dryland ecosystems. CASCADE Project Deliverable 5.1. |
An area under pressure from grazing
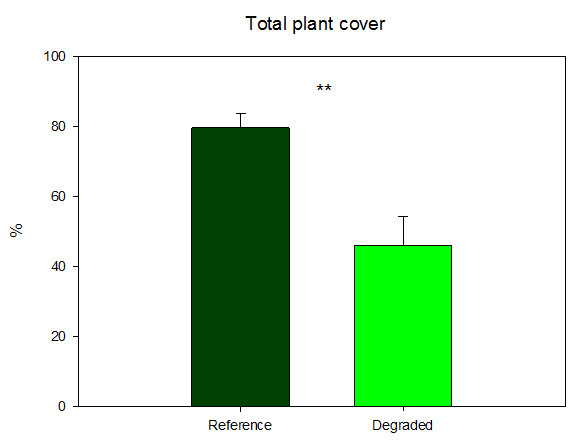
The grazing degradation pressure resulted in a trend to decrease the total plant cover values in Randi field site with a significant decrease from 79.6 to 46.0%. We observed a great variability of plant cover in the three replicates of the Degraded state of the ecosystem with values running from 28.3 to 61.1%. Local conditions and/or pressure levels might be differentially acting in the three degraded plots.
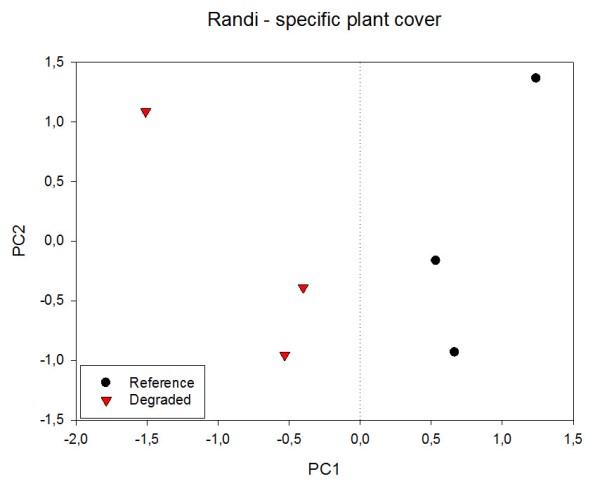
We found a total of 21 plant species in all Randi plots but only 7 were common to the Reference and the Degraded sites. Cistus creticus was the species with highest cover in the Reference sites with 36.7%, followed by Calicotome villosa, Lithodora hispidula and Pistacia lentiscus with 15.5, 15.3 and 12.0%, respectively. On the contrary, only one species of the Asteraceae family overcame 10% of cover in the Degraded sites (12.5%) while Sarcopoterium spinosum and C. villosa showed very similar and lower percentages (6.6 and 6.4%, respectively). We found a clear separation of the plots according to the degradation pressure after the PCA analysis that included all 21 species found. The first axis explained 45.8% of the variance and the second one an additional 22.7%. Plot separation was significant in the first axis where woody shrubs C. creticus, L. hispidula, Genista sphacelata, P. lentiscus and Rosmarinus officinalis were positively extracted (eigenvalues 0.858, 0.812, 0.760, 0.732 and 0.703, respectively) and the shrub Rhamnus oleoides, the bulb Asphodelus aestivus, and the herbaceous Trifolium campestre, Arum italicum and the Asteraceae were negatively extracted (eigenvalues of -0.937, -0.852, -0.740, -0.740 and 0.723, respectively). Reference plots showed positive values of PC1 associate to high woody shrub cover while Degraded plots showed negative values of this axis with more abundance of herbs and grasses. The second axis did not contribute to any further separation of plots under the different pressure states.
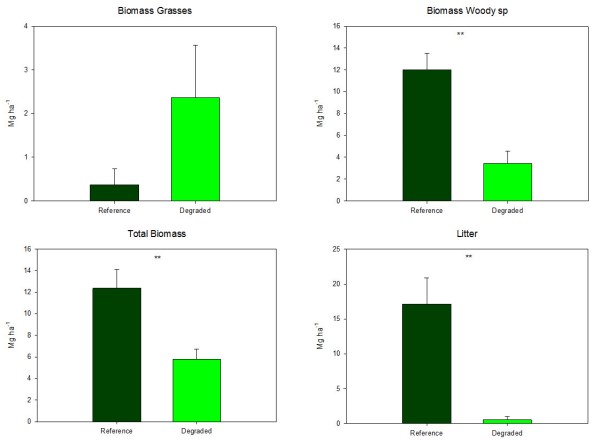
There are clear differences in biomass build up and its fractioning between plant life traits according to degradation in Randi forest plots. The biomass of grasses in the sampling in Spring 2015 in the Degraded sites is six times higher than in the Reference ones but the large variability among Degraded plots (from 0.83 to 5.12 Mg ha-¹) prevented significant differences to appear (t=1.387, p=0.238). The absence of grazing resulted in significant higher biomass of woody species and overall biomass (t=-4.293, p=0.013 and t=-3.229, p=0.32, respectively). Woody biomass was 3.5 times higher in the Reference than in the Degraded plots, mostly due to the high presence of Cistus creticus in the ungrazed plots (6.6 Mg ha-¹) while this species was absent in the Degraded ones. This lower development of shrubs resulted in sharp and significant (t=2.079, p=0.045) reduction of litter accumulation in the Degraded areas.
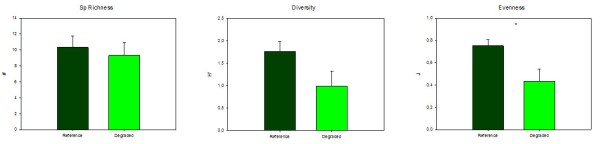
Degradation did not affect the total number of plant species but, as mentioned above, it affected species identity. The average number of species per plot found in Randi was 10 and the Reference sites showed higher diversity according to the diversity and evenness indices. Shannon’s index was 1.76 and 0.99 in the Reference and Degraded plots, respectively, while the evenness was significantly lower (t=-2.605, p=0.060) in the Degraded than in the Reference (0.43 vs 0.75, respectively).
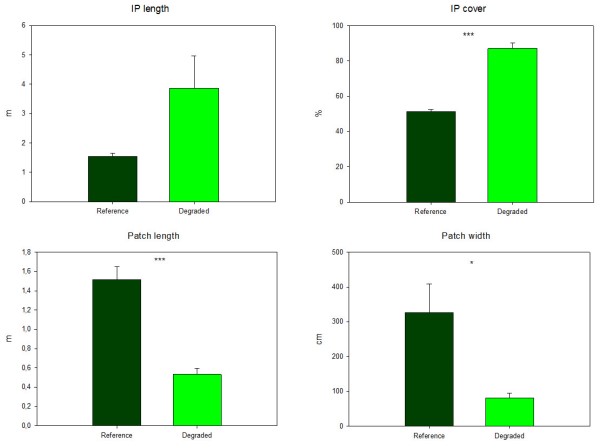
We found a clear modification in the arrangement and morphology of vegetation patches and interpatches in relation to degradation. Firstly, 81.4% of the land in the Degraded communities was occupied by interpatches (soil, grasses and stones) while they occupied 51.2% of the Reference plots (t=11.205, p<0.001). In addition, these interpatches were more than two times larger in the Degraded than in the Reference (3.86 vs 1.54 m) but difference were not statistically significant (t=2.102, p=0.167). Similarly, the typology of patches (shrubs and subshrubs) was also significantly different between degradation states, with more than three times longer (t=-6.7018, p=0.003) and wider (t=2.968, p=0.092) patches in the Reference than in the Degraded. As a consequence, degraded sites presented higher connectivity between export/source areas and had small, scarce and dispersed patches of woody vegetation that affect ecosystem functioning.
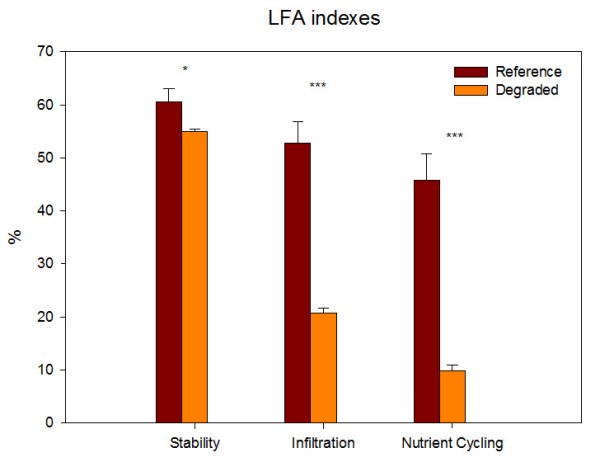
All three indices derived from the LFA assessment showed significant decreases as affected by degradation pressure. The highest differences were observed in the nutrient cycling index with a reduction from 45.8% in the Reference to 9.9% in the Degraded (t=-7.125, p=0.002). This represents a dramatic alteration of the maintenance and recycling of nutrient resources in the system. The infiltration index was also sharply reduced by grazing with a decrease from 52.8 to 20.8% (t=-7.771, p=0.001) with a significant impact on water conservation. The stability index was also significantly affected by grazing (t=-2.242, p=0.088) but differences were not as marked as for the previous two indices.
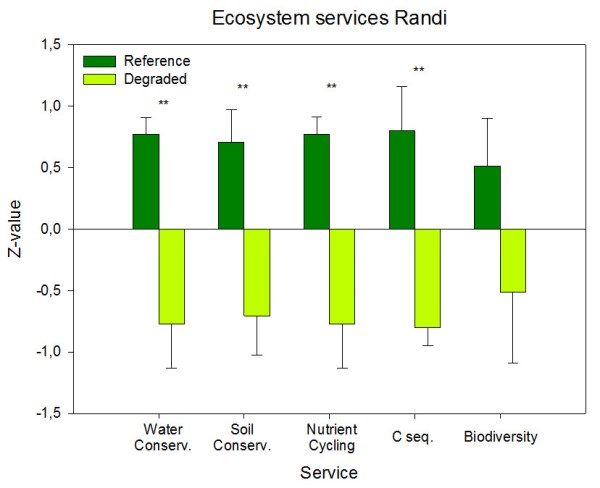
All the ecosystem services considered were severely affected by grazing. Water conservation (t=-4.062, p=0.015), soil conservation (t=-3.373, p=0.028), nutrient cycling (t=-4.003, p=0.016) and C sequestration (t=-4.152, p=0.014) showed significant losses due to grazing practices conducted on the sites. Biodiversity was also reduced but the magnitude of the loss was not significant (t=-1.474, p=0.215). The combination of all these results reveals a severe loss of environmental services in Randi associated to heavy grazing activities.
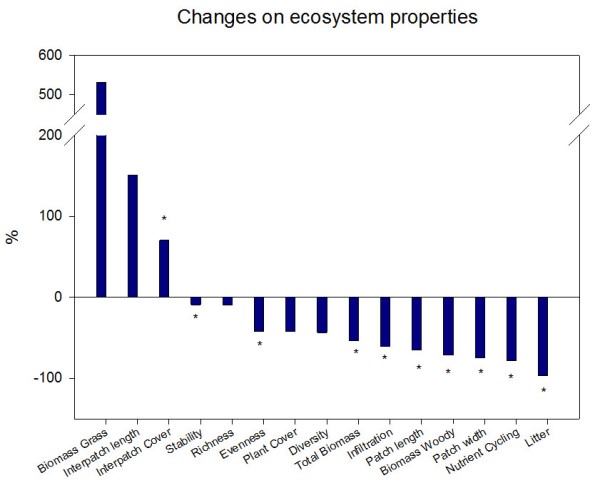
All ecosystem properties were negatively affected by grazing. The positive values of biomass of interpatch lengths can be considered as a degradation effect of the given pressure. Only the biomass of grasses was promoted by grazing.
Note: For an overview of the structural and functional changes and their analysis in all study sites see »Structural and functional changes.