| Authors: | Alejandro Valdecantos (CEAM),V. Ramón Vallejo (UB), Susana Bautista (UA), Matthijs Boeschoten (UU), Michalakis Christoforou (CUT), Ioannis N. Daliakopoulos (TUC), Oscar González-Pelayo (UAVR), Lorena Guixot (UA), J. Jacob Keizer (UAVR), Ioanna Panagea (TUC), Gianni Quaranta (UNIBAS), Rosana Salvia (UNIBAS), Víctor Santana (UAVR), Dimitris Tsaltas (CUT), Ioannis K. Tsanis (TUC) |
| Editor: | Jane Brandt |
| Source document: | Valdecantos, A. et al. (2016) Report on the restoration potential for preventing and reversing regime shifts. CASCADE Project Deliverable 5.2 104 pp |
- Restoration by long-term grazing exclusion increased plant cover, litter accumulation and aboveground biomass to similar levels found in the undisturbed reference areas
- Plant composition and spatial structure of vegetation (cover and size of patches and interpatches) also reflected differences in the three ecosystem states
- Ecosystem functioning, mainly nutrient cycling and infiltration, is sharply improved in the restored areas but are still far to the values observed in the references
- The five ecosystem services calculated did not show differences between the Restored and the Reference areas and were significantly improved form the Degraded lands
- Restoration in Randi can be considered as successful with the approach followed in the project
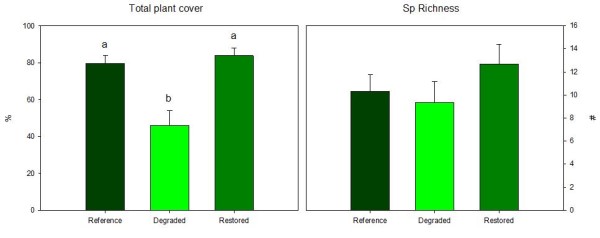
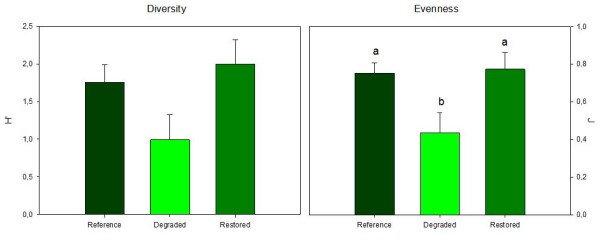
The passive restoration in Randi significantly increased plant cover percentage from the Degraded areas to the same values than the References. Plant cover in the Degraded plots is 46.0% and the Reference and Restored are 79.6 and 83.8%, respectively (Figure 1). The Restored plots showed the highest average number of vascular plants (12.7) in contrast to the Degraded and the undisturbed reference (9.3 and 10.3, respectively). The two diversity indexes evaluated (Shannon-Wiener’s and evenness) showed similar trends in the three states of the ecosystem (Figure 2): the Degraded areas presented the lowest values of both indexes and the Restored reached the same values than the Reference. Shannon’s doubled from 1.0 to 2.0 while the evenness moved from 0.43 to 0.77.
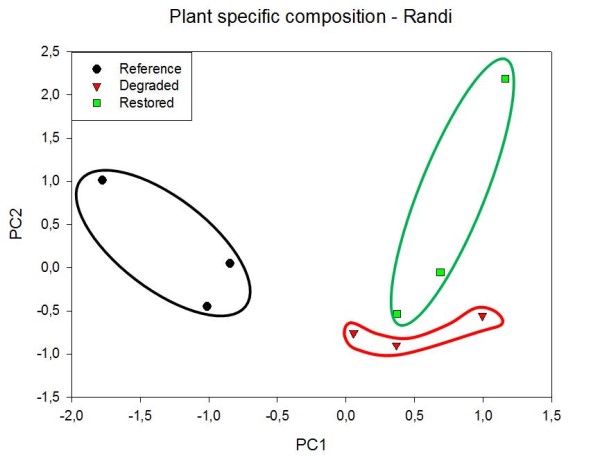
Twenty-three species were found in Randi but only six species were present in the three ecosystem states. The References were characterized by high cover of shrubs like Cistus creticus (36.7%), Calycotome spinosa (15.5%), Lithodora hispidula (15.3%) and Pistacia lentiscus (12.0%). Other key species that were only present in the undisturbed areas were, in addition to P. lentiscus, Pinus halepensis and Rosmarinus officinalis. The Degraded state showed low plant cover and most of it was due to a species of the family Asteraceae (undetermined) with 12.5%. Sarcopoterium spinosum is the most abundant species in the Restored areas (25.1%) with an extended cover of an unidentified grass (24.7%) and, in a lesser extent, C. spinosa (11.1%). The graphical representation of the two first axis of the Principal Component Analysis on plant cover data clearly grouped the plots by state (Figure 3). PC1 and PC2 explained 30.9 and 19.2% of the variance and, hence, jointly explained more than half of it. The extraction of species along the first two components of the PCA is shown in Annex I. Reference plots showed the lowest values of the PC1 and separated these plots from the other two groups. Degraded and Restored plots separated along the second axis, with higher and more heterogeneous values of the restored plots.
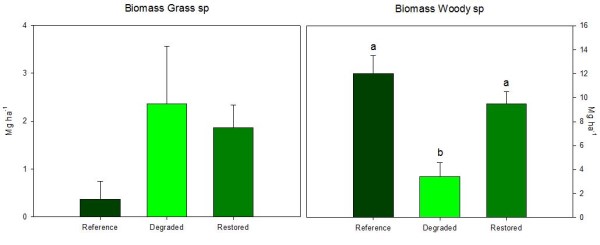
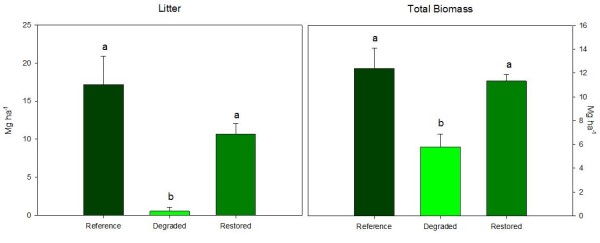
Biomass accumulation in the different components of the ecosystem of the restored areas is more similar to the references than to the degraded lands (Figures 4 and 5). Degraded areas showed relatively high amounts of herbaceous biomass and low litter and biomass of woody species. The Restored plots significantly increased the woody biomass (from 3.4 to 9.5 Mg/ha) and the litter accumulation on the ground (20 times larger in the restored than in the degraded) while the biomass of grasses was slightly reduced by the restoration. None of the three biomass components (woodies, grasses and litter) were significantly different in the Restored than in the Reference plots. Total biomass in the Restored areas was two times higher that of the Degraded ones (Figure 5).
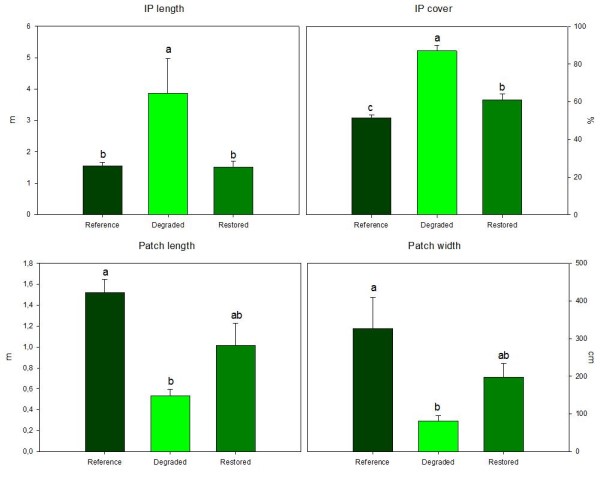
Both the spatial distribution and size of patches and interpatches were significantly affected by restoration (Figure 6). The percentage of land covered by interpatches was reduced from 87.1% in the degraded areas to 61.0% in the restored, much closer to the 51.4% observed in the references. Also the length of the interpatches was lower in the restored than in the Degraded (1.5 and 3.9 m, respectively). Conversely, the size of the patches in the restored plots were among the size of the reference and the degraded areas. Average patch size in the degraded plots were 0.53 m long and 0.81 m wide while in the restored plots they averaged 1.01 m long and 1.98 m wide.
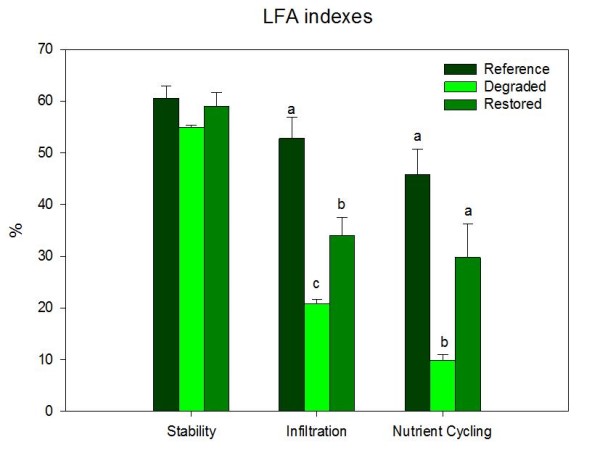
The largest changes in LFA derived indexes were observed in nutrient cycling and infiltration (Figure 7). These two indexes were significantly improved by restoration, from 9.9 to 29.8% the former and from 20.8 to 34.0% the latter. However, reference plots still showed higher values of the three indexes, especially infiltration and nutrient cycling. Changes in stability were minor and not significant.
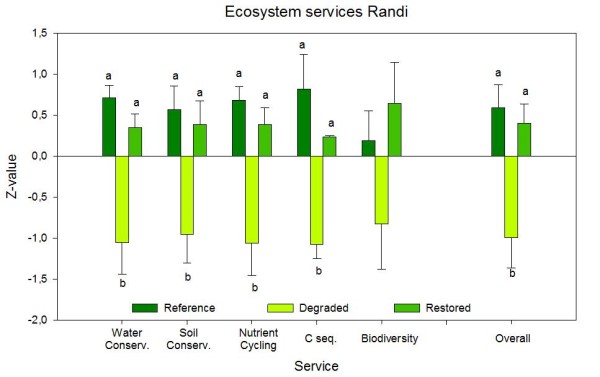
All calculated ecosystem services but biodiversity were improved in the restored plots in relation to the degraded ones as well as the averaged combination of the five services assessed (Figure 8). Biodiversity was the service that released he highest increase (1.47) but the heterogeneity of the variables included in this service in the different replicates of each ecosystem state prevented significant differences. Nutrient cycling (1.45) and water conservation (1.40) also showed large increase after restoration. All individual services and also their combination showed no difference between the restored and the reference areas suggesting a high effectiveness of the restoration measures (grazing exclusion) in improving ecosystem services.
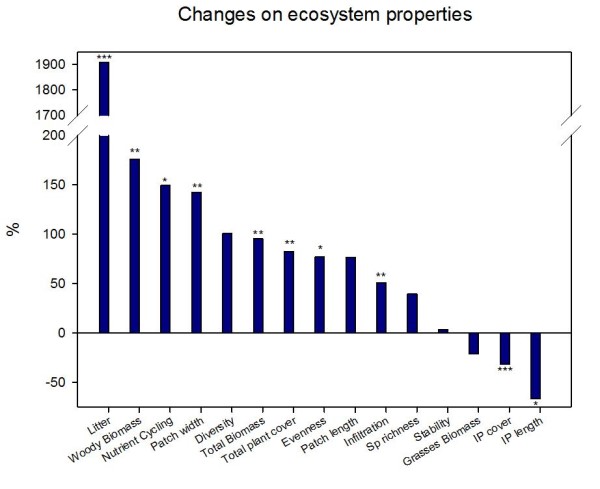
Figure 9 summarizes the relative changes of the measured and calculated ecosystem properties in the restored in relation to the degraded state of Randi ecosystems. The largest increase in litter accumulation and, in a lesser extent, the build up of woody biomass and patch size led to a significant improvement of nutrient cycling and infiltration indexes.The three properties that showed negative values (herbaceous biomass, and interpatch cover and length) can also be considered as positive symptoms to the recovery of a healthy ecosystem closer to the reference target state.
Note: For full references to papers quoted in this article see