| Authors: | Alejandro Valdecantos and Ramón Vallejo (CEAM) with input from study sites |
| Editor: | Jane Brandt |
| Source document: | Valdecantos & Vallejo. (2015) Report on structural and functional changes associated to regime shifts in Mediterranean dryland ecosystems. CASCADE Project Deliverable 5.1. |
An area under pressure from grazing
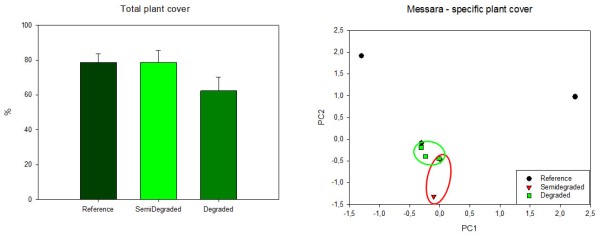
The degradation pressure in Messara resulted in a trend to reduce total plant cover under the highest pressure level. Both Reference and Semi-degraded ecosystems showed percentages of plant cover slightly below 80% while this variable dropped to 62.5% in the highly degraded sites. Sarcopoterium spinosum was the most abundant species in the Reference state, with 13.3%, followed by Salvia fruticosa and Crepis conmutata that both presented cover values below 10% . In the Semi-degraded plots, three shrubs were the most abundant species: Thymbra capitata, Crepis cretica and S. spinosum, with cover percentages of 18.0, 14.5 and 11.6%, respectively. Avena sp also showed cover values above 10%. Thymbra capitata was the most common species also in the Degraded sites, but with lower cover percentages than in the Semi-degraded (14.5%). This was the only species that showed cover values above 10% in the highly Degraded plots. The Reference and the Degraded were the situations that shared the higher number of species (19) while the Semi-degraded showed lower number of common species with the other two ecosystem states (12 and 13 with the Degraded and Reference, respectively). However, the PCA conducted on the specific plant cover data (42.0% of explained variance with the two first axis) showed that the plots of the two considered degradation states are closer than with the undisturbed ones. The three Reference plots showed high variability regarding specific plant cover as the only well-represented species in all three plots was S. spinosum (17.7, 12.1 and 10.1%). One of the plots showed a high percentage of Avena sp (20.7%) and another one was rich in Salvia fruticosa and Calicotome villosa (26.8 and 12.6%, respectively). These species were almost absent in the other two plots. Olea europaea, S. furticosa, Gladiolus italicus, Ononis sp, Phagnalon graecum, C. villosa and Leontodon tuberosum were positively extracted on PC1 (eigenvalue ≈ 0.9) while Hyparrhenia hirta was the species with higher positive weight on PC2 (eigenvalue = 0.881).
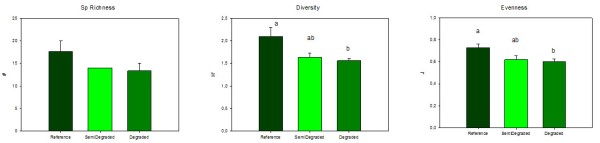
The three plant biodiversity variables showed the same decreasing trend as the grazing pressure increased. Total number of plant species was highest in the Reference state (17.7) and lowest in the Degraded plots (13.3). The Shannon-Wiener index of diversity was marginally affected by grazing (F=3.815, p=0.099) with values of 2.09, 1.63 and 1.56 in the Reference, Semi-degraded and Degraded states, respectively. Similar effect was observed in evenness with marginal significant differences (F=4.201, p=0.085) between Reference and Degraded states (0.73 and 0.60, respectively).
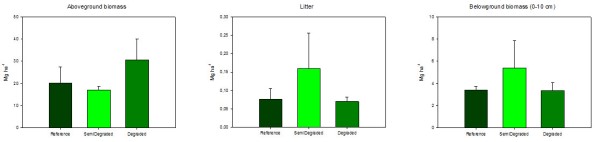
Surprisingly, the Degraded plots showed the highest values of aboveground biomass but differences were not statistically significant (F=0.774, p=0.509) as a large range of values were observed (from 9.14 to 46.72 Mg ha-¹). This fact could have been related to the higher amount of annuals in the degraded sites and the sampling time (spring). Litter and belowground biomass in the uppermost 10 cm of soil did not result neither in significant differences between pressure states but showed a trend to increase in the intermediate pressure state.
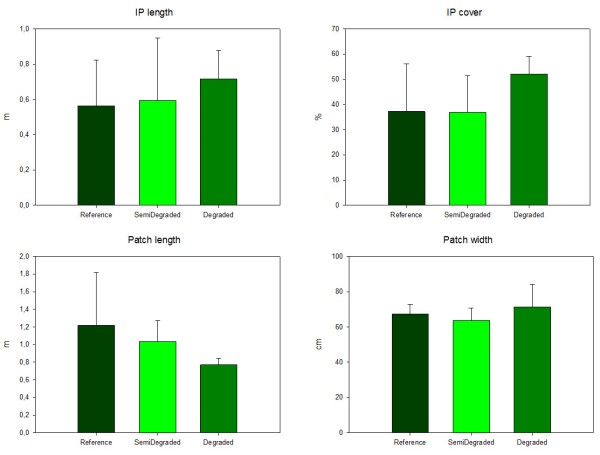
Interpatches in Messara consisted of bare soil and ground covered by litter or herbs and patch areas were shrubs, subshrubs and tussock grasses. The spatial distribution of vegetation showed very similar patterns in the three pressure states. There was a trend to increase the interpatch length and cover as the grazing pressure increased with more than 50% of the land of the Degraded state corresponding to source areas with an average length of 72 cm. On the contrary, the length of vegetated patches in the Reference was 122 cm as compared to 77 cm in the Degraded plots. Semi-degraded areas showed intermediate values of these features of spatial distribution of vegetation. The width of the vegetated patches was very similar in all states.
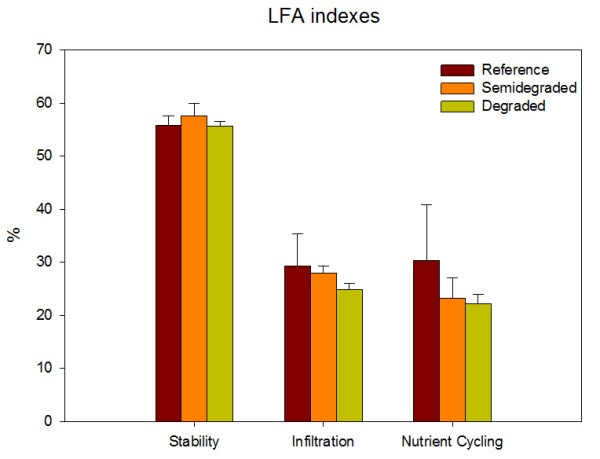
The stability index derived from LFA assessment showed similar values in all pressure states while there was a trend to decrease in both the infiltration and nutrient cycling indices as the pressure level increased. However, no significant differences were observed in the stability (F=0.368, p=0.709), infiltration (F=0.343, p=0.725) and nutrient cycling indices (F=0.393, p=0.694).
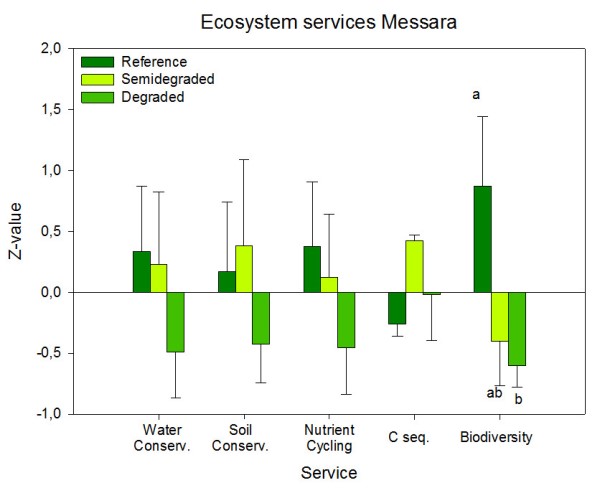
The Degraded state showed a loss of most calculated ecosystem services except C sequestration. The most pronounced and significant loss was observed in the Biodiversity service that combines data from plant species richness, diversity and evenness. The standardized value of Biodiversity dropped from 0.87 in the Reference to -0.60 in the highly Degraded sites. Soil and water conservation and nutrient cycling showed similar losses with increasing the grazing pressure. In spite of aboveground biomass showed a trend to increase in the Degraded ecosystem, the observed values of litter and belowground biomass (higher in the Semi-Degraded) resulted in higher C sequestration potential in the Semi-Degraded system than both in the Reference and degraded ones. Probably changes on plant composition also affected to C sequestration. There is a trend to decrease the values of ecosystem services as the grazing pressure increases.
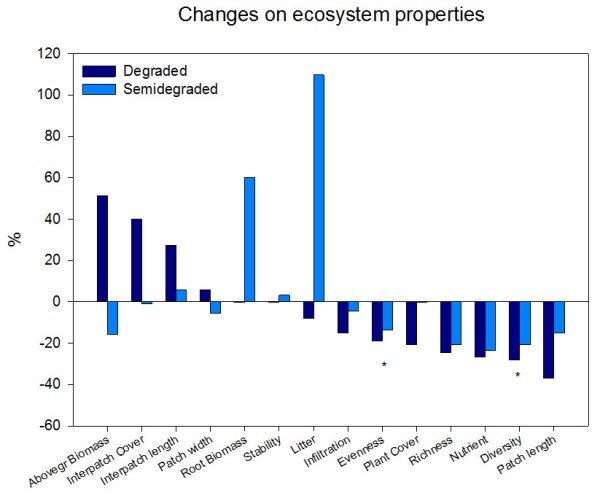
Heavily degraded sites showed an increase just in one property of the ecosystems in relation both to the Reference and the Semi-degraded sites that is aboveground biomass. Positive changes in interpatch cover and length can be interpreted as a negative consequence of pressure as they increase the proportion of bare soil. Significant losses have also been observed regarding evenness and diversity as well as the size of the plant patches. However, the magnitude of losses of the Degraded areas in relation to the Reference does not exceed 40%.
Note: For an overview of the structural and functional changes and their analysis in all study sites see »Structural and functional changes.