| Authors: | Ángeles G. Mayor, V Ramón Vallejo, Susana Bautista with Peter de Ruiter, Lia Hemerik, Violette Geissen, Jaap Bloem, Jacob Kéizer, Óscar González-Pelayo, Ana Isabel Machado, Sílvia Faria, Ana Vasques, Luna Morcillo, Rosario López-Poma, Azucena Camacho, Anna Urgeghe, Diana Turrión, Christel van Eck, Martinho Martins, Paula Maia, Alejandro Valdecantos, Jaime Baeza, Joan Llovet, David Fuentes, Giovanni Quaranta, Rosanna Salvia, Velia De Paola, Ioannis N. Daliakopoulos, Ioanna Panagea, Ioannis K. Tsanis, Michalakis Christoforou, Christiana Papoutsa, Dimitris Tsaltas, Kostas Andreou, Kyriakos Themistokleous, Giorgos Papadavid and Diofantos Hatzimitsis. |
| Editor: | Jane Brandt |
| Source document: | Mayor et al. (2017) Identification of critical changes preceding catastrophic shifts: ecosystems affeced by increasing grazing intensity and severe drought. CASCADE Project Deliverable 3.1b |
The drought-stress manipulative experiment aimed to evaluate the effect of imposed drought on the plant-soil system. It was established for moderate-stress level of either grazing intensity or fire frequency, depending on the experimental site. The experiment was carried out in the six CASCADE study sites, which ranged in natural annual precipitation from 268 mm in Santomera (Spain) to 1290 mm in Castelsaraceno (Italy). Moreover, weather variability between the study sites was particularly high during the experimental period (September 2013- November 2015), with the wettest sites having a very wet period (sites in Portugal and Italy) while the driest sites experienced particularly dry years (sites in Spain and Cyprus).
Experimental design
The drought-stress treatment was applied on plots of around 2 m2 in size. For each of these plots, we considered two microsites: soils under the target plant, i.e., vegetation-patch microsite (P microsite), and the respective upslope (bare-soil) interpatch microsite (IP).
The drought experiment was set-up using special roofs constructed ad hoc that captured rainfall to induce drought below the roof (Figure 1). In order to minimize greenhouse effects on the experimental plots due to the rainfall-exclusion plots, we built a fully translucent cover, supported by metallic poles. To minimize the lateral influx of water from overland flow from the upslope area, metal sheets were inserted into the ground around the plot. The roofs designed for this experiment were made by two layers of V-profile transparent polycarbonate gutters, which conduct the rainfall water to an external gutter connected to a water storage tank, which allow measuring the excluded rain (Figure 1). When placed upside-down, the roof allows the rain to go through and thus works as a roofed control, with similar roof effects (e.g., greenhouse effect) except rainfall exclusion. It is important to highlight that the goal of the treatment was not to completely avoid soil wetting during rainfall but to decrease plant water availability relative to the controls. Indeed, soil wetting during rainfall is possible in the rainfall exclusion roofs when wind is strong and/or there is subsurface runoff.
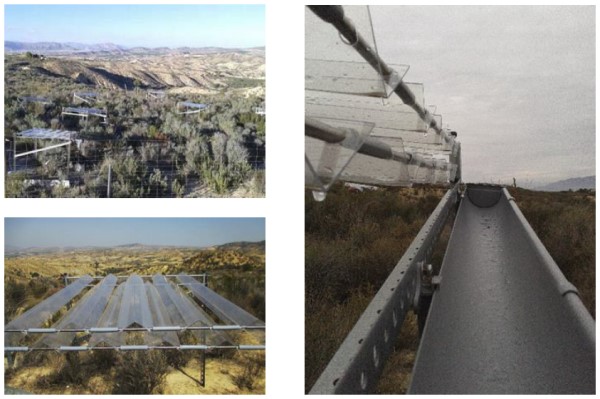
Figure 1
We established three treatments:
- Non-roofed controls (hereafter, C_NoR);
- Rainfall-inclusion roofed control (hereafter, C_R); and
- Rainfall-exclusion roofs (Drought treatment, hereafter, D).
To address the exceptional climatic variation among sites for the study period, special efforts were made to make the drought treatments comparable between sites. The duration of the experiment was established to guarantee that the rainfall received in the roofed plots during the 12 months previous to the end of the experiment were around or below the 1st percentile of the mean annual rainfall for the long-term reference period (30-50 years). Due to the extreme natural drought experienced in some sites the experiment needed a particularly long period to achieve the 1st percentile value. In all sites except Castelsaraceno, the experiments were extended several additional months (the number varying between sites) after achieving the 1st percentile, with the longest experiment conducted in the driest sites: Santomera (completed by December 2015) and Messara (completed by November 2015).
Soil nutrient availability and labile C, and plant performance were measured in all plots at the beginning of the experiment and at ∼4 months intervals. Measurements on plant reproductive effort were taken during the flowering-fruiting seasons. Using TDR probes, soil moisture was measured on a continuous basis for both the soil underneath plant patches and the upslope bare-soil interpatch.
Plant and soil measurements
Table 1. summarizes the soil quality and plant performance parameters measured in the drought experiment.
Table 1: Vegetation and soil variables (0-5 cm) for repeated measurements at each site for the drought-stress experiment. The sets of parameters measured per site could slightly differ, because of plant/soil/ecosystem properties and available expertise/equipment.
| Variable types | Várzea (Portugal) | Santomera (Spain) | Valencia (Spain) | Castelsaraceno (Italy) | Messara (Crete) | Randi (Cyprus) | |
| Vegetation | Vegetation growth | Height, Basal diameter, Canopy, BBD, BL, Biomass | TBD, TL, Biomass | BBD, BL | Canopy, Biomass | Biomass | Height, Canopy, BBD, BL |
| Soft eco-physiological traits | SLW, RWC | SLA, Huber index | RWC | SLW, RWC | RWC | RWC | |
| Reproductive effort | Flowers, fruits | Flowers | Flowers | Flowers, Spikes | Flowers | ||
| Soil | Nutrient availability | PMN, NH4+, NO3- | P, PMN, NH4+, NO3- | P, PMN, NH4+, NO3- | P, PMN | Available P, PMN, NH4+, NO3- | Available P, PMN, NH4+, NO3- |
| Labile pool of soil Carbon | WSC, HWC | DOC, HWC | DOC | HWC | HWC | DOC, HWC | |
| Soil moisture | SWC (Continuous monitoring) | SWC (Continuous monitoring) | SWC (Continuous monitoring) | SWC (Continuous monitoring) | SWC (Continuous monitoring) | SWC (Continuous monitoring) |
Acronyms list: ● Vegetation growth: TBD: Twig Basal Diameter; TL: Twig length; BBD: Branch Basal Diameter; BL: Branch length. ● Soft eco-physiological traits: SLW: Specific Leaf Weight; RWC: Relative Water Content; SPAD: Chlorophyll content. ● Soil characterization: CEC: Cation-Exchange Capacity SOC: Soil Organic Carbon. ● Nutrient availability: PMN: Potentially Mineralisable Nitrogen. Available P (AvailP) ● Labile pool of soil C: DOC: Dissolved Organic Carbon; HWC: Hot Water Extractable Carbon. ● SWC: Soil Water Content.
Statistical analysis
We analysed all the variables measured for patch (P) and interpatch (IP) microsites using Repeated Measures ANOVA (GLM) with Treatment (D), with three levels, i.e. C_NoR, C_R and R, as between-subject factor and Time (T) as within-subject factor. All data met the normal distribution of residuals and homoscedasticity assumptions. All analyses were carried out using v.23.0 Statistical package (SPSS Inc., Chicago, IL, USA).
Note: For full references to papers quoted in this article see