| Authors: | Ángeles G. Mayor, V Ramón Vallejo, Susana Bautista with Peter de Ruiter, Lia Hemerik, Violette Geissen, Jaap Bloem, Jacob Kéizer, Óscar González-Pelayo, Ana Isabel Machado, Sílvia Faria, Ana Vasques, Luna Morcillo, Rosario López-Poma, Azucena Camacho, Anna Urgeghe, Diana Turrión, Christel van Eck, Martinho Martins, Paula Maia, Alejandro Valdecantos, Jaime Baeza, Joan Llovet, David Fuentes, Giovanni Quaranta, Rosanna Salvia, Velia De Paola, Ioannis N. Daliakopoulos, Ioanna Panagea, Ioannis K. Tsanis, Michalakis Christoforou, Christiana Papoutsa, Dimitris Tsaltas, Kostas Andreou, Kyriakos Themistokleous, Giorgos Papadavid and Diofantos Hatzimitsis. |
| Editor: | Jane Brandt |
| Source document: | Mayor et al. (2017) Identification of critical changes preceding catastrophic shifts: ecosystems affeced by increasing grazing intensity and severe drought. CASCADE Project Deliverable 3.1b |
1. Effect of drought-stress on soil quality
Figure 1 shows the results for potentially mineralisable nitrogen (PMN) and hot water-extractable carbon (HWC) measured at the Várzea site in Portugal. Both variables showed similar values for patch and interpatch microsites. None of the variables was significantly affected by the drought treatment (Table 1). HWC showed a significant variation in time, peaking in March 2014.
In Castelsaraceno, the dynamics of potentially mineralisable nitrogen (PMN) and hot water-extractable carbon (HWC) did not show any significant effect of the drought treatment (Figure 2), yet both variables showed statistical variation in time. Given the homogeneity of the vegetation in Castelsaraceno, we only considered the patch microsite in this site.
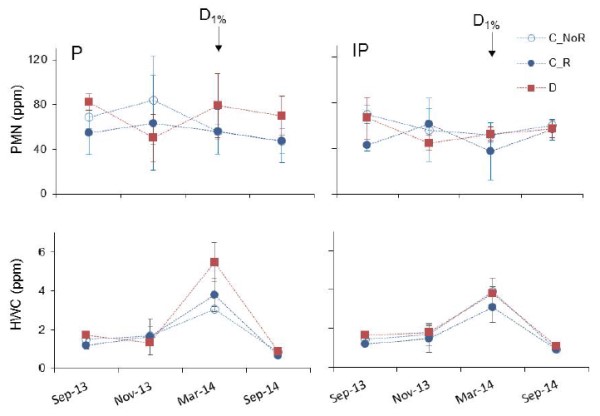
Figure 1 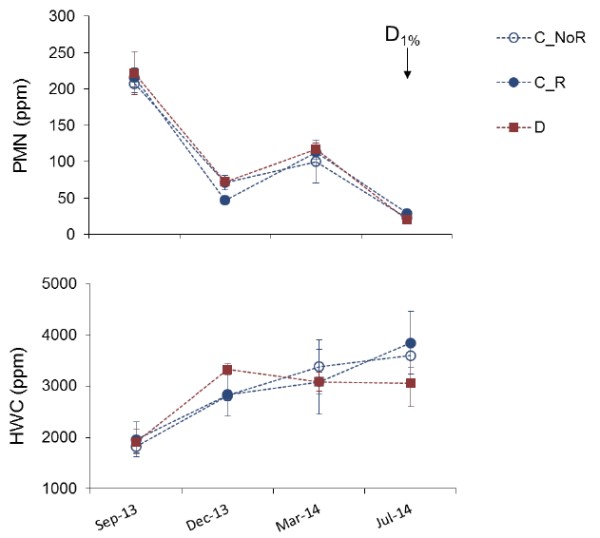
Figure 2
In the Valencia site, patch and interpatch microsites showed similar values (Figure 3) and none of the assessed variables showed any significant effect of the drought treatment (Figure 3 Table 1), with PMN and DOC showing significant variation in time (Table 1).
Figure 4 shows the results from the Messara site in Crete. Likewise the sites reported above, patch and interpatch areas showed similar trends and values. Available phosphorus and potentially mineralisable nitrogen (PMN) did not show any significant effect of the drought treatment (Table 1), while hot water-extractable carbon (HWC) showed significantly different dynamics as a function of the drought treatment, with overall higher values in the open (C_NoR) controls. The three variables showed significant variation in time (Table 1).
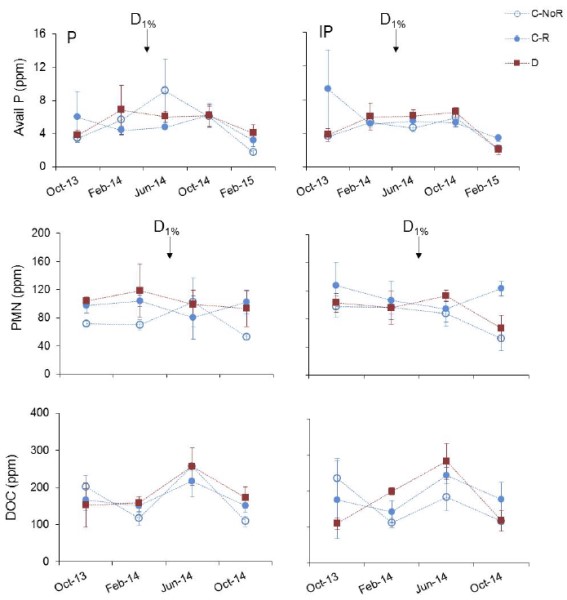
Figure 3 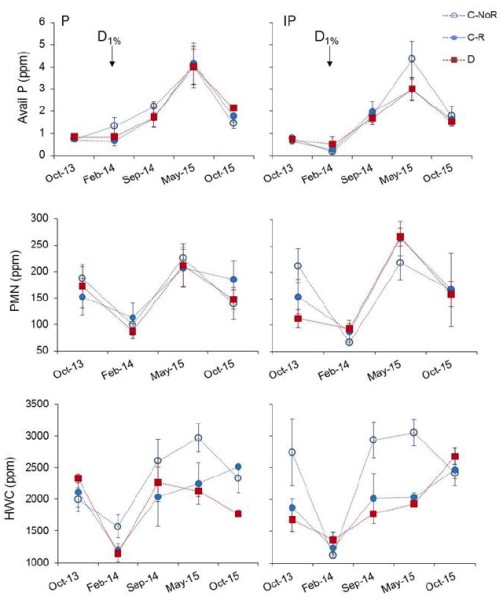
Figure 4
Figure 5 shows the results from the Santomera site in Spain. Overall, patch soils showed slightly higher values than interpatch soils. Available P did not show a statistically significant effect of the drought treatment, while PMN in interpatches showed significantly different dynamics and higher values for the drought treatment as compared with both controls (Figure 5; Table 1). Similarly HWC showed a marginally significant increase for the drought treatment in interpatches. All the variables showed significant variation along the study period.
Figure 6 shows the results from the Randi site in Cyprus. Similar to the case in Santomera site, only PMN showed a significant effect of the drought treatment (Table 1), with a higher increase in the patch microsites for the drought plots than for the control plots towards the end of the experiment.
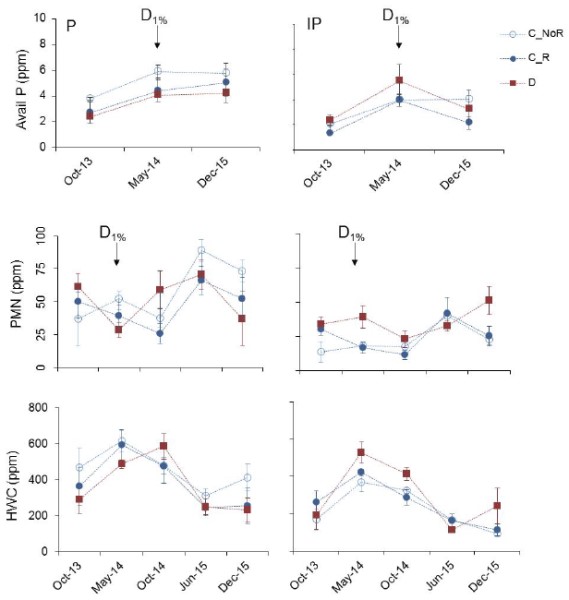
Figure 5 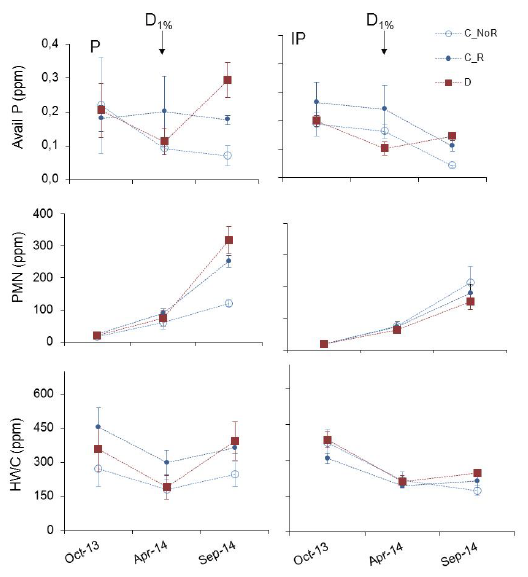
Figure 6
Table 1. Statistics results (F and P-values) of the Repeated Measures Analysis of Variance for the soil variables:
| Várzea | Castelsaraceno | Valencia | Messara | Santomera | Randi | |||||||
| P | IP | P | P | IP | P | IP | P | IP | P | IP | ||
| Factor | F (P) | F (P) | F (P) | F (P) | F (P) | F (P) | F (P) | F (P) | F (P) | F (P) | F (P) | |
| PMN | T | 0.2 (0.896) | 0.1 (0.951) | 92.9 (<0.001) | 0.4 (0.759) | 1.0 (0.420) | 11.4 (<0.001) | 19.2 (<0.001) | 5.4 (0.002) | 4.6 (0.004) | 124.0 (<0.001) | 47.6 (<0.001) |
| DS | 0.4 (0.707) | 0.1 (0.941) | 0.5 (0.651) | 1.1 (0.379) | 2.0 (0.232) | 0.8 (0.924) | 0.01 (0.991) | 3.7 (0.068) | 5.7 (0.025) | 7.2 (0.025) | 0.7 (0.519) | |
| T*DS | 0.5 (0.82) | 0.4 (0.888) | 0.4 (0.836) | 0.9 (0.509) | 0.9 (0.524) | 0.8 (0.592) | 1.4 (0.251) | 1.3 (0.271) | 2.0 (0.082) | 10.5 (0.001) | 0.6 (0.674) | |
| AvailP | T | 2.3 (0.087) | 3.3 (0.029) | 26.3 (<0.001) | 53.9 (<0.001) | 9.0 (0.002) | 9.7 (0.001) | 1.0 (0.386) | 7.1 (0.009) | |||
| DS | 0.1 (0.900) | 0.9 (0.440) | 0.1 (0.893) | 0.5 (0.601) | 1.2 (0.355) | 1.4 (0.303) | 0.6 (0.581) | 2.0 (0.200) | ||||
| T*DS | 0.8 (0.569) | 1.4 (0.250) | 0.4 (0.897) | 1.1 (0.362) | 0.3 (0.852) | 0.8 (0.551) | 1.7 (0.214) | 1.6 (0.247) | ||||
| DOC | T | 4.2 (0.020) | 4.2 (0.024) | |||||||||
| DS | 1.0 (0.409) | 0.2 (0.808) | ||||||||||
| T*DS | 0.5 (0.790) | 1.9 (0.151) | ||||||||||
| HWC | T | 16.4 (<0.001) | 7.2 (0.009) | 15.1 (<0.001) | 16.5 (<0.001) | 17.0 (<0.001) | 16.8 (<0.001) | 20.1 (<0.001) | 9.2 (0.004) | 21.2 (<0.001) | ||
| DS | 0.9 (0.475) | 1.2 (0.404) | 0.03 (0.974) | 2.1 (0.187) | 8.8 (0.012) | 0.9 (0.455) | 3.3 (0.085) | 1.5 (0.305) | 2.2 (0.193) | |||
| T*DS | 1.4 (0.307) | 0.3 (0.923) | 0.9 (0.490) | 2.2 (0.060) | 3.7 (0.005) | 1.1 (0.409) | 1.3 (0.264) | 1.2 (0.374) | 0.9 (0.481) | |||
Potentially mineralisable nitrogen (PMN), available phosphorus (Avail P), dissolved organic carbon (DOC) and hot water extractable carbon (HWC) for Várzea, Castelsaraceno, Valencia, Messara, Santomera and Randi sites. Time (T) was used as within-subject factor and Drought Stress (DS) as between-subject factor. T * DS represent the interaction between the two factors. Significant results (p<0.05) and highlighted in bold and marginally significant results (p<0.1) in italics.
2. Effect of drought-stress on plant performance parameters
Figure 7 shows the variation in branch basal diameter (BBD), both as absolute figures and as figures relative to the initial value, for the target plant species as a function of the drought treatment in the Várzea site, Portugal. There was a continuous increase in branch diameter with time, due to the plant regrowth after the wildfire of September 2012, yet there was no statistically significant effect of the drought treatment (Table 2).
Canopy cover (CC) of the target species in Castelsaraseno, Italy, did not show any significant effect of drought, yet there was a significant interaction between Time and Drought factors, with similar variation in canopy for the two controls and drought treatment before the 1st percentile target for the drought treatment was achieved and a higher increase in canopy for the open controls after that moment (Figure 8; Table 2).
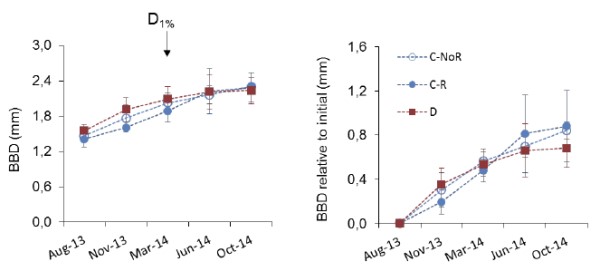
Figure 7 
Figure 8
Branch length (BL) of the target species in the Valencia site in Spain showed no significant effect of the drought treatment, yet there was a trend towards a lower increase in BL with time for the drought treatment (Figure 9; Table 2).
For the plant biomass (PB) of the target grass species in Messara, Crete, there was no statistically significant effect of the treatments on the absolute or the relative values (Figure 10; Table 2).
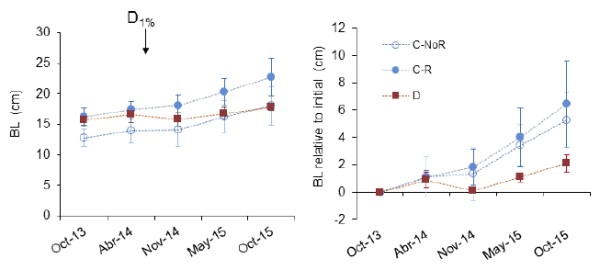
Figure 9 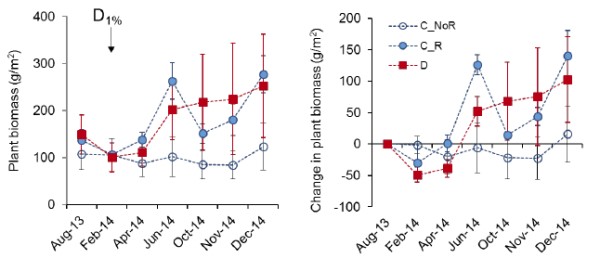
Figure 10
Conversely, the change in twig length (TL) of the target shrub species in Santomera, Spain, and the height of the target shrub species in Randi, Cyprus, showed significantly lower values for the drought treatment than for the roofed controls, C_R (Figure 11 and 12, respectively; Table 2).
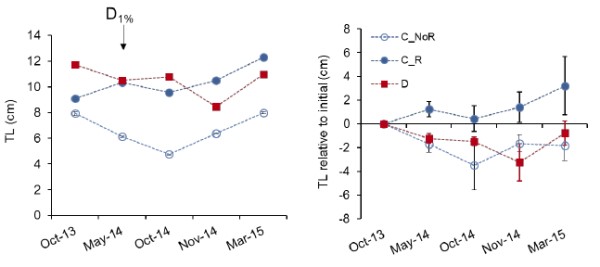
Figure 11 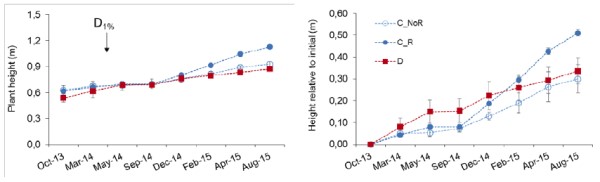
Figure 12
Table 2. Statistics results (F. and P-values) of the Repeated Measures Analysis of Variance for plant performance variables:
| Site | Variable | T (F(P)) | DS (F(P)) | T*DS (F (P)) |
| Várzea | BBD | 13.8(<0.001) | 0.2(0.857) | 0.3(0.973) |
| Change in BBD | 5.9(0.006) | 0.03(0.966) | 0.3(0.932) | |
| Castelsaraceno | Canopy | 5.4(0.008) | 3.2(0.115) | 2.8(0.044) |
| Change in canopy | 5.0(0.027) | 2.8(0.135) | 2.7(0.080) | |
| Valencia | BL | 10.8(<0.001) | 1.3(0.338) | 1.0(0.463) |
| Change in BL | 12.4(<0.001) | 0.7(0.517) | 1.2(0.354) | |
| Messara | Biomass | 7.4(<0.001) | 1.4(0.310) | 2.0(0.051) |
| Change in biomass | 7.7(<0.001) | 1.8(0.232) | 2.0(0.063) | |
| Santomera | TL | 1.8(0.149) | 2.2(0.178) | 1.4(0.248) |
| Change in TL | 2.2(0.114) | 3.3(0.099) | 0.5(0.765) | |
| Randi | Height | 89.1(<0.001) | 3.5(0.098) | 4.5(<0.001) |
| Change in height | 86.6(<0.001) | 1.4(0.306) | 5.5(<0.001) |
Branch basal diameter (BBD), canopy cover, branch length (BL), plant biomass, twig length (TL) and plant height, and their values relative to the start of the experiment for Várzea, Castelsaraceno, Valencia, Messara, Santomera and Randi. Time (T) was used as within-subject factor and Drought Stress (DS) as between-subject factor. Significant results (p<0.05) and highlighted in bold marginally significant results (p<0.1) in italics.
3. Effect of drought-stress on soil moisture
Figure 13 shows the dynamics of monthly rainfall and soil water content (SWC) for the wettest study sites: Várzea (Portugal) and Castelsaraseno (Italy). in both sites, the control plots without roof showed the highest SWC values, yet only for the patch microsite in Várzea site. Castelsaraseno showed particularly high SWC values as compared to the other sites.
Figure 14 shows rainfall and SWC dynamics for Valencia (Spain) and the Messara (Crete). In general, SWC showed a trend towards lower values for patches than for interpatches, particularly for the drought (D) treatment and in Messara. In Valencia, the highest SWC values were found for the roofed control treatment (R-C), either for patch or interpatch microsites, and the lowest for the drought treatment (D) in soils under plant patches. In Messara, there were no clear differences between control and drought plots.
Soil water content in Randi showed similar dynamics than in Messara, with lower values in patches than in interpatches (Figure 15), while in Santomera, there were no relevant differences between microsites. In Randi, interpatch SWC showed higher values for control than for drought plots, while soils under plant patches did not show any treatment effect. In Santomera, both patches and interpatches showed higher values for control than for drought plots, yet only at the end of the study period, once the natural extreme drought that occurred in the area was over.
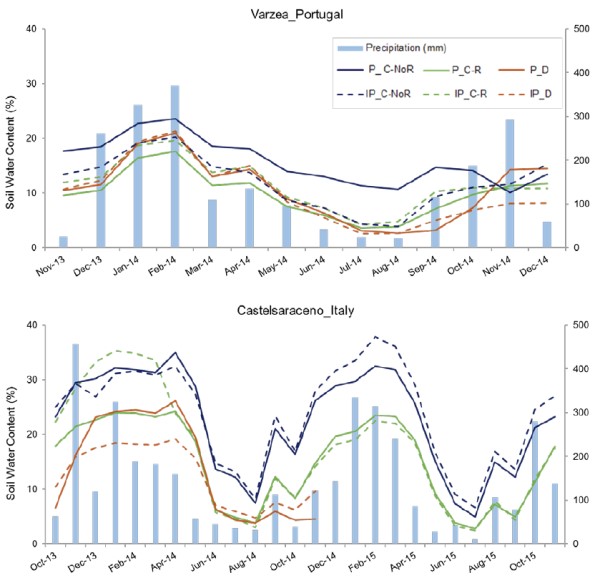
Figure 13 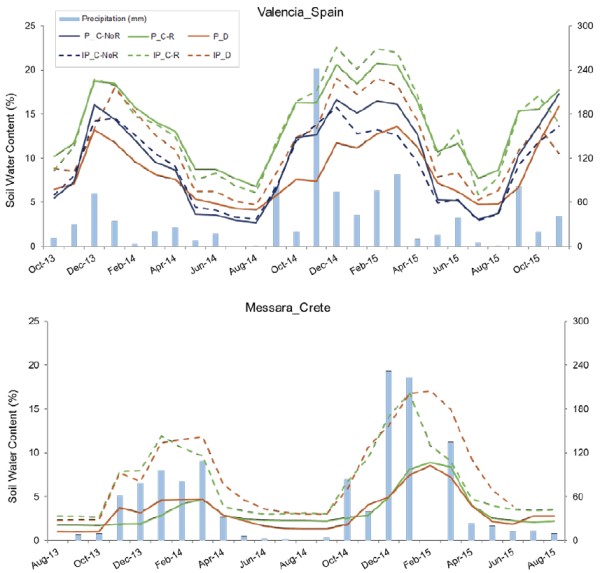
Figure 14 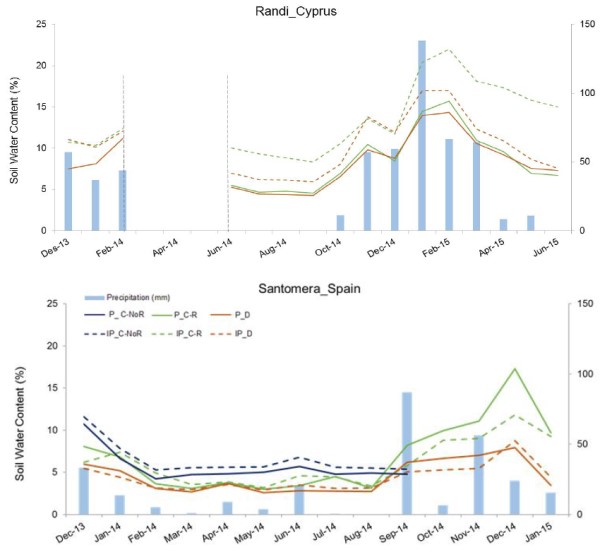
Figure 15
4. Discussion
For the driest sites, Randi and Santomera, we found increased PMN and, to a lesser extent, labile C forms (HWC) values with increased drought stress towards the end of the experiment, but none of the other four sites showed any relevant effect of increased drought. Similarly, we found no clear treatment effect on plant performance, except for Randi and Santomera, which showed a decreasing trend in plant growth with increasing drought stress. These results indicate an extraordinary capacity of the plant-soil systems of very dry areas to cope with drought, as only the combined effect of a severe natural drought plus the additional experimentally-induced drought finally resulted in decreased plant growth. The increased PMN and HWC values found in the driest sites in response to increased drought could be explained by an increased amount of litter and dead roots being degraded (López-Poma and Bautista, 2014).
The observed soil moisture dynamics confirmed that the roofs captured rainfall, as both controls gave in most cases higher values for soil water content (SWC) than the drought treatments, but also that the impact of the drought treatment was very different between sites. This probably resulted from the occurrence of exceptionally dry conditions during the experimental period in the dry sites, and exceptionally wet conditions in the wet sites, with both cases leading to small differences between roofed and no roofed plots. Hence, in the dry sites insufficient rainfall is captured to obtain differences between treatments, while in the wet sites the soil beneath the roofs stayed wet through influx of water from outside the roofs. For those ecosystems to drive to tipping points for catastrophic shifts to happen requires probably longer and more severe periods of drought.
Also unexpectedly, the results hinted to a positive side effect of the roofs, e.g. in the form shading or keeping air humidity higher, yet this effect would not be consistent across sites. These results highlight the need for using roofed controls to properly assess the effects of rainfall exclusion. Using examples of plant performance data from the various study sites, Figure 22 further explores and illustrates this finding. By comparing each treatment with the appropriate respective control (i.e., drought versus roofed control and roofed versus non-roofed controls), we found both a negative effect of induced drought and a positive effect of the roof on plant performance, both being higher in drier areas (Figure 16).
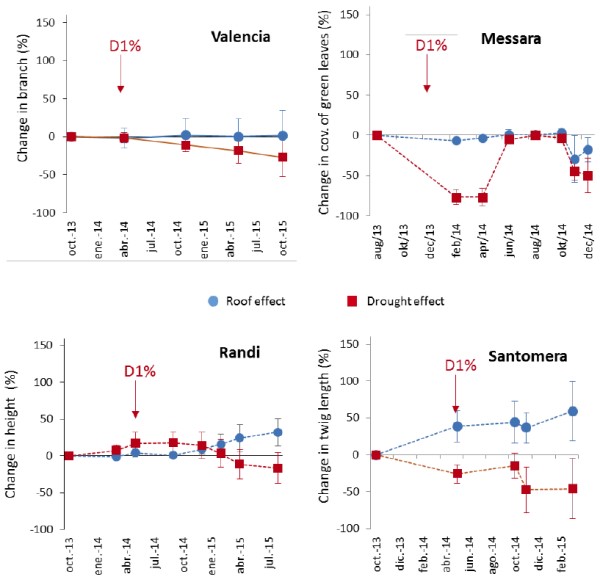
Figure 16
Note: For full references to papers quoted in this article see