| Authors: | Alejandro Valdecantos (CEAM),V. Ramón Vallejo (UB), Susana Bautista (UA), Matthijs Boeschoten (UU), Michalakis Christoforou (CUT), Ioannis N. Daliakopoulos (TUC), Oscar González-Pelayo (UAVR), Lorena Guixot (UA), J. Jacob Keizer (UAVR), Ioanna Panagea (TUC), Gianni Quaranta (UNIBAS), Rosana Salvia (UNIBAS), Víctor Santana (UAVR), Dimitris Tsaltas (CUT), Ioannis K. Tsanis (TUC) |
| Editor: | Jane Brandt |
| Source document: | Valdecantos, A. et al. (2016) Report on the restoration potential for preventing and reversing regime shifts. CASCADE Project Deliverable 5.2 104 pp |
- Different restoration approaches were considered depending on the sense of the grazing pressure: Fencing in case of overgrazing, and clearing woody vegetation in case of undergrazing.
- The degradation due to overgrazing seems more pronounced than that due to undergrazing. The losses of services provided in relation to the reference productive grasslands in the overgrazed are higher than in the undergrazed.
- Ten years after the application of restoration, the ecosystem services evaluated in this study have been slightly improved.
- Biodiversity is the most improved service associated to the two restoration approaches.
- In the areas affected by overgrazing, restoration did not achieve the overall balance of services provided by the references while in the undergrazed areas the restoration through clearing showed the highest balance of services.
- Provisioning services associated to grazing should be specifically considered in Castelsaraceno and integrate them into the final analysis.
Overgrazed and Fenced systems
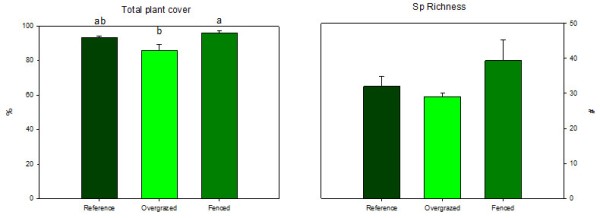
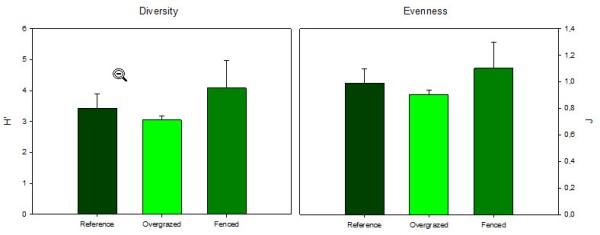
Plant cover in all three situations in Castelsaraceno was above 85 % but significant differences were observed between the Overgrazed and the Fenced areas (Figure 1 left; 98.9 and 86.1%, respectively). Plant cover in the Overgrazed areas was due to 29 species while in the Fenced sites we found an average of 39.3 species (Figure 1 right).Diversity indexes (and evenness) did not show significant differences between the three states of the ecosystem (Figure 2). However, we observed a trend to increase diversity in the restored areas in relation to the degraded ones. Shannon-Wiener’s and evenness increased in a 34.0 and 22.0%, respectively, ten years after fencing the overgrazed areas.
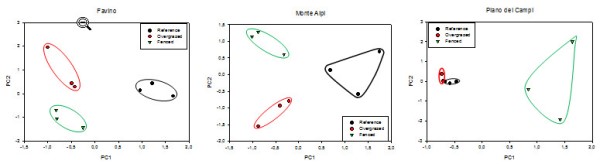
A total of 171 species of vascular plants were recorded in the 45 plots established in Casatelsaraceno. Plant composition was different according to the state of the ecosystem in the three experimental sites. We have analyzed plant composition separately in each of the three experimental for clarity in the changes due to the state of the ecosystem. In Favino, only 12 out of 55 recorded species were found in the three states of the ecosystem. In the Reference plots, the species with higher abundance were Medicago minima (17.9%), Poa pratensis (15.4%), Trifolium repens (13.4%) and Brachypodium rupestre (10.4%). Two species were the most abundant both in the overgrazed and fenced plots: Trifolium incarnatum (22.9 and 12.9%, respectively) and B. rupestre (18.4 and 12.9%, respectively). The graphical representation of the two first axis of the Principal Component Analysis on plant cover data clearly grouped the plots by state (Figure 3). In Favino, with 55 species in the analysis, the first and second components explained 23.8 and 18.9% of the total variance. The Reference plots showed highest values of the first component while the second component separated the Overgrazed plots (higher values in PC2) and the Fenced plots (lower values).
Sixty-two species were present and included in the analysis in Monte Alpi, 12 of them were present in all three ecosystem states. Bromus erecti and Brachypodium rupestre showed the highest cover in the Reference community (20.9% both), followed by Satureja montana and Stipa austroitalica with 14.4 and 10.9%, respectively. Cynosurus cristatus and B. erecti were the most abundant in the overgrazed (13.4% both) while Stipa austroitalica (39.9%), B. erecti (29.4%) and S. minor (19.4%) abounded in the Fenced plots. Species which characterized the References were Lonicera caprifolium, Medicago lupulina and P. hirsutum. The Overgrazed and Fenced communities separated along the second axis with negative values of the Fenced plots and positive values of the Overgrazed ones.
In Piano del Campi, 80 species were found in the 9 plots and only nine species were common to the three states. Scorzonera villosa (38.3%), Bothriochloa ischaemum (35.8%) and, in a lesser extent, Triticum ovatum (17.4%) and Dactylis glomerata (11.9%) were highly represented in the Reference community. The Overgrazed plots also presented high cover of S. villosa and B. ischaemum and T. ovatum (36.3, 25.4 and 17.4%, respectively) but also showed high cover of S. austroitalica (32.3%). Eleven species showed cover values above 10% in the Fenced areas. Xeranthemum cilindraceum, Daucus carota and B. rupestre showed the highest cover percentages in these areas (27.9, 27.4 and 21.9, respectively). The two first axis of the PCA explained 51.8% of the total variance (34.1 and 17.7%, respectively). In this site, Reference and Overgrazed plots were quite similar in composition as observed in Figure 3. Fenced plots were clearly separated from the rest along the first axis but showed high heterogeneity along the second axis.
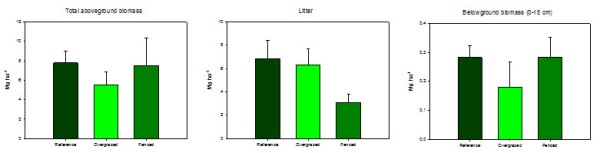
We observed some small changes in the different biomass fractions of the community but these changes were not significant (Figure 4). Average aboveground biomass was 36.6% higher in the Fenced than in the Overgrazed areas and similar to the values of the Reference ecosystem. Belowground biomass in the uppermost 15 cm of the soil showed the same trend than aboveground biomass but, surprisingly, litter showed the opposite trend with a reduction of about 50% in the Fenced plots. However, data heterogeneity was large enough to prevent significant differences.
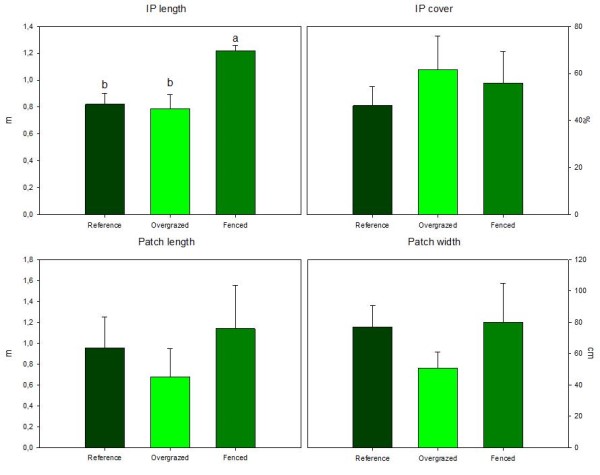
Fencing significantly increased the length but not the total cover of interpatches in relation to both the Overgrazed and the Reference situations (Figure 5). However, in all the systems of Castelsaraceno interpatches do not represent bare soil areas but a matrix of herbs and grasses. Size of patches, woody plants or a mix of woodies and herbs, tended to increase in the Fenced areas with increases aorund 60% both in length and width in relation to the Overgrazed areas.
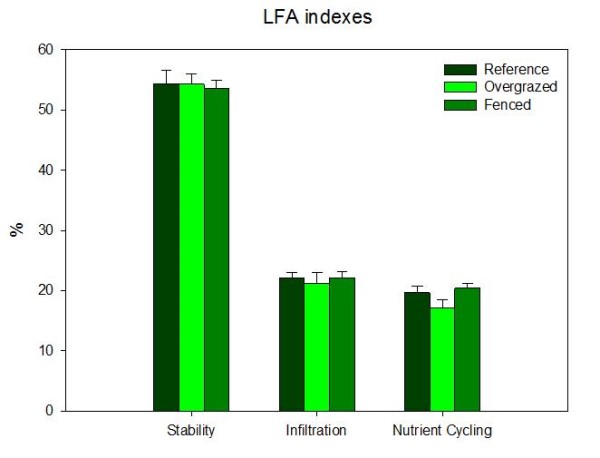
The three indexes derived from LFA were quite similar in the three studied situations (Figure 6). Stability is only slightly reduced from the Reference in the Overgrazed and Fenced areas while the nutrient cycling index is relatively increased in a 19.8% in the Fenced as compared to the Overgrazed plots.
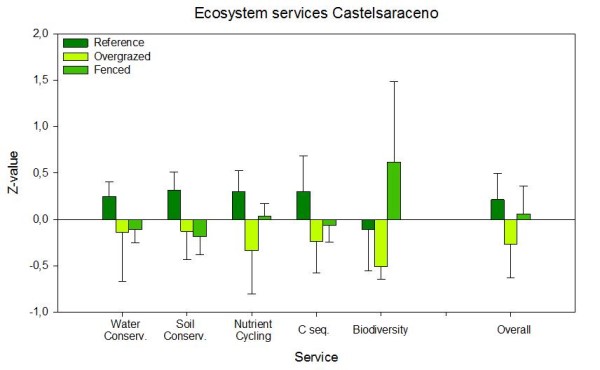
Ecosystem services calculated from these properties are shown in Figure 7. Restoration by fencing implied an increase (not significant) of nutrient cycling, C sequestration and, especially, biodiversity from the Overgrazed state of the ecosystem. This former service was also well above in the Restored than in the Reference sites. Water and soil conservation did not show important changes due to restoration. The combination of all calculated services showed that the Restored system through fencing overgrazed areas resulted in an increase of ecosystem services but still below the services provided by the Reference ecosystem.
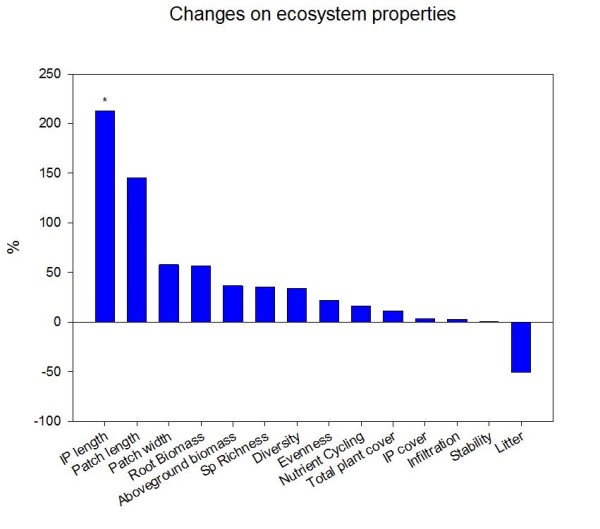
All the ecosystem properties evaluated in this study were higher in the Fenced than in the Overgrazed lands of Castelsaraceno except litter accumulation (Figure 8). However, these improvements are not yet translated to significantly better ecosystem services after the type of restoration assessed.
Undergrazed and Cleared systems
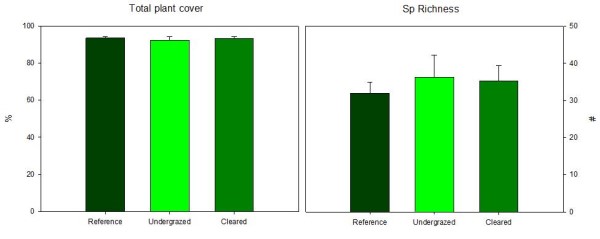
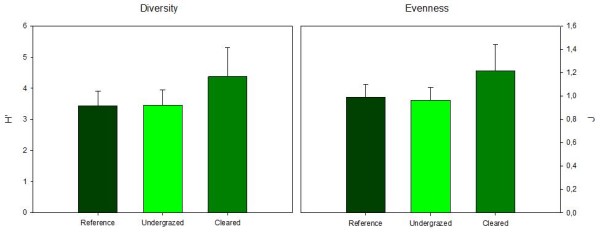
The opposite to the above mentioned situation is represented by areas in which the grazing pressure is very low, with symptoms of shrub encroachment and where the restoration approach consisted in clearing woody vegetation. In comparison to the reference grassland, both the degraded and the restored plots did not show significant changes either in total plant cover or number of vascular plant species (Figure 9). Plant cover in all three situations was very high (above 92%) and the total number of plant species found was 142, slightly higher in the Undergrazed and, in a lesser extent, in the Cleared states than in the Reference. Diversity and evenness indexes showed a trend to increase (26% higher values in relation to the degraded state) in the Cleared plots in relation to the other two situations (Figure 10).
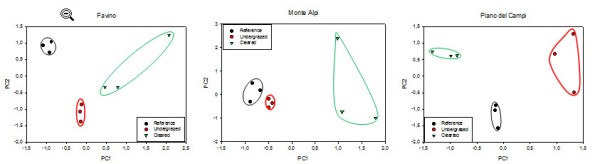
Twenty-four species were shared by the three states of the ecosystem. Also 24 species were only found in the Reference plots, 20 in the Undergrazed plots, and 29 were exclusive of the Cleared ones. In Favino, the three most abundant species in the Reference plots (Medicago minima, Poa pratensis and Trifolium repens with 17.9, 15.4 and 13.4%, respectively) were not found in the other states. Brachypodium rupestre, one of the species present in all communities, was the most abundant one in the Undergrazed (50.7%), but the second and third species with highest cover (Spartium junceum and Festuca circummediterranea, with 45.3 and 26.4%, respectively) were specific of the Undergrazed plots. Another woody species, such as Crataegus monogyna (15.4%), presented relative high cover in this situation. In the Cleared plots, the species with highest cover was Agrostis stolonifera (24.9%) which was absent in the Reference and Undergrazed plots. These contrasted composition of species resulted in clearly separated groups after PCA analysis in the three spatially replicated sites (Figure 11). The two first components of the analysis in Favino explained 48.9% of the total variance and included 73 species. The three replicates of both the Reference and Undergrazed plots were very close in the graphical representation of these two axes revealing high similarity of plant composition while the Cleared plots showed a wider range of values along these two axes. Something similar was observed in Monte Alpi (90 species in the analysis and 45.1% of explained variance by the two first axes), with plots plotted close for the Undergrazed and Reference states but more separated, especially along the second axis, in the case of Cleared plots. The proximity of the reference and undergrazed groups of plots can be related to the grazing pressure that might not be much contrasted. In Piano del Campi, with 69 species included in the PCA (46.1% of explained variance by the two first axes), the three groups of plots were separated along the first axis and the References also showed lower values of the second axis than the Undergrazed and Cleared groups of plots.
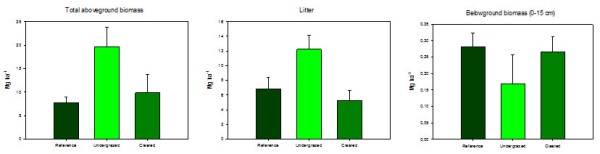
We observed an opposite effect of clearing in above and belowground accumulation of biomass (Figure 12). Both aerial plant biomass and litter were sharply reduced (but not significantly) to similar values than the reference areas by the restoration treatment implemented in Undergrazed plots. These reductions were around 50%. In contrast, belowground biomass in the uppermost 15 cm of soil was increased in 56.6% in the restored sites in comparison to the Undergrazed. These findings might be related to the relative changes in plant composition and species life traits (life cycle, leaf life span and production, rooting patterns) associated to the clearing treatment.
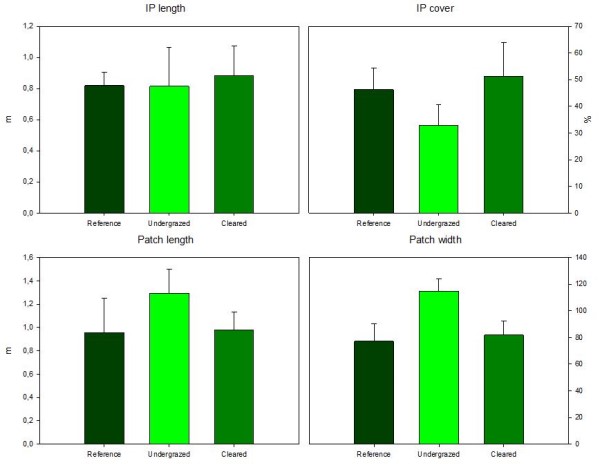
The arrangement of vegetation in the space was only slightly changed ten years after restoration. The length and cover of interpatches were very similar in all three situations (Figure 13). The percentage of land associated to interpatches (a matrix of grasses and forbs) increased in ca. 56% in the Cleared sites as compared to the Undergrazed ones. Conversely, the size of patches (mainly due to woody plants) was sharply reduced in 24 and 29% (length and width, respectively). The Cleared areas were much more similar to the Reference than the degraded Undergrazed ones.
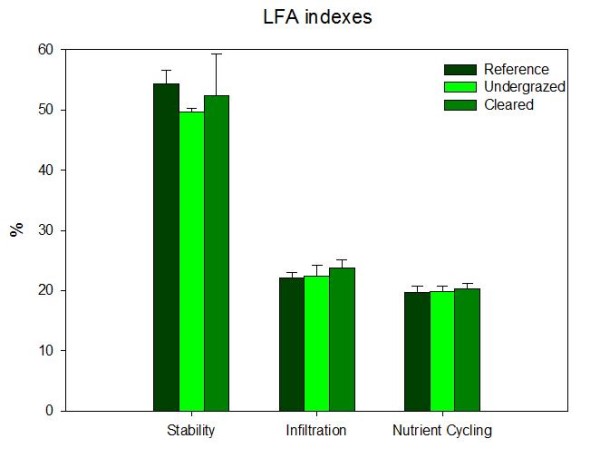
The stability, infiltration and nutrient cycling indexes derived from the LFA assessment did not show important differences between the three states of the ecosystem (Figure 14). However, the Cleared plots showed a slight improvement of these indexes (lower than a relative 10% in all cases) in relation to the Undergrazed plots.
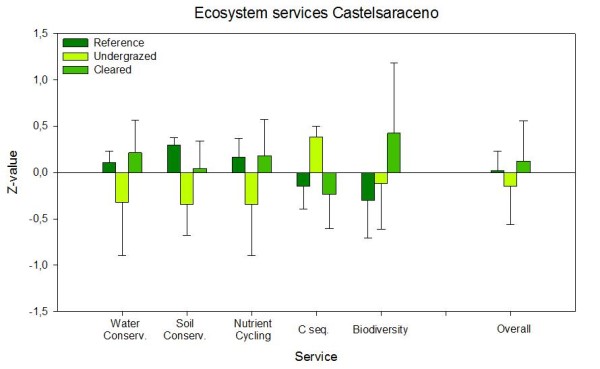
All ecosystem services except C sequestration were improved in the Cleared plots in relation to the Undergrazed ones (Figure 15). The latter showed a clear reduction in soil and water conservation and nutrient cycling as compared both to the Reference and the Cleared sites. On the contrary, the reduction of the grazing pressure increased C sequestration notably in respect to the two alternative situations. The highest value of the combination of all the services considered in this study was observed in the restoration areas. However, there are other provisioning services associated to grazing that might reverse the final balance.
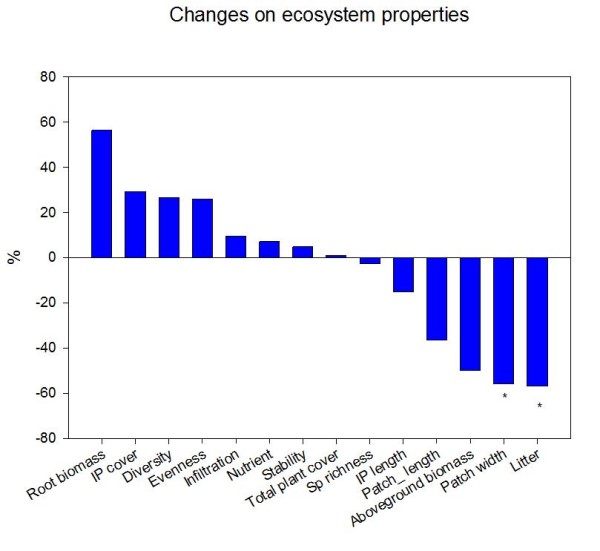
In this case, aproximately half of the ecosystem properties we have evaluated showed improvements and the other half were reducedafter restoration while other such as total plant cover (close to 100% in both cases) and species richness showed very little changes (Figure 16). Only the size of the patches and litter accumulation were significantly reduced in the Cleared areas in relation to the Undergrazed.
Note: For full references to papers quoted in this article see