| Authors: | Alejandro Valdecantos (CEAM),V. Ramón Vallejo (UB), Susana Bautista (UA), Matthijs Boeschoten (UU), Michalakis Christoforou (CUT), Ioannis N. Daliakopoulos (TUC), Oscar González-Pelayo (UAVR), Lorena Guixot (UA), J. Jacob Keizer (UAVR), Ioanna Panagea (TUC), Gianni Quaranta (UNIBAS), Rosana Salvia (UNIBAS), Víctor Santana (UAVR), Dimitris Tsaltas (CUT), Ioannis K. Tsanis (TUC) |
| Editor: | Jane Brandt |
| Source document: | Valdecantos, A. et al. (2016) Report on the restoration potential for preventing and reversing regime shifts. CASCADE Project Deliverable 5.2 104 pp |
- Old restoration especially affected the contributions of sink and source areas to the landscape and their morphology
- New restoration especially affected biodiversity and vegetation structure and biomass
- The extremely harsh conditions in Albatera determine low recovery rates of ecosystem structure and function after restoration
- New restoration improved ecosystem services in higher extent than old restoration in Albatera
- At the medium and long term after restoration, ecosystem services are still far from those provided by natural undisturbed ecosystems
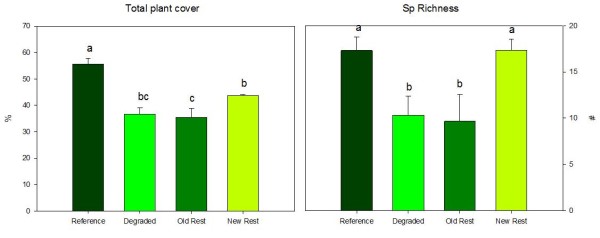
The two restoration approaches did not significantly improved total plant cover in relation to the degraded state (Figure 1 left). In fact, the old restoration showed the lowest values of plant cover (35.5%), significantly lower than the new restoration (43.6%) and the references (55.6%). Considering the four ecosystem states, we found 32 vascular species in Albatera, being the richest states both the reference and the new restoration plots (17.3 species) and the poorest the old restoration with only 9.7 species present (Figure 1 right). Four species were present in the four situations (Fumana thymifolia, Fagonia cretica, and the grasses Brachypodium retusum and Stipa tenacissima) while other four shrubs were only found in the reference plots (Whitania frutescens, Ephedra sp, Pistacia lentiscus and Cistus clusii). Six species were exclusive of the new restored sites, some of them, like Olea europaea, Lygeum spartum and Juniperus oxycedrus, were introduced during the restoration activities.
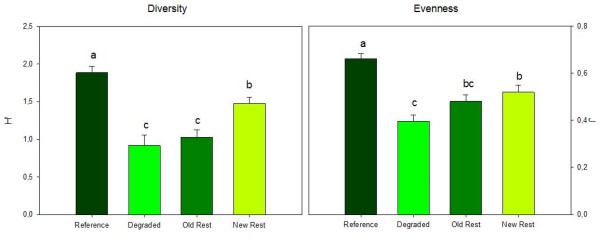
In addition to species richness, diversity and evenness indexes were significantly reduced in the degraded areas (0.92 and 0.40, respectively) as compared to the references (1.89 and 0.66, respectively). We observed a slight trend in the old restoration to increase these indexes while the improvements in the new restoration were statistically significant but did not reach the reference values (1.48 and 0.52, respectively; Figure 2).
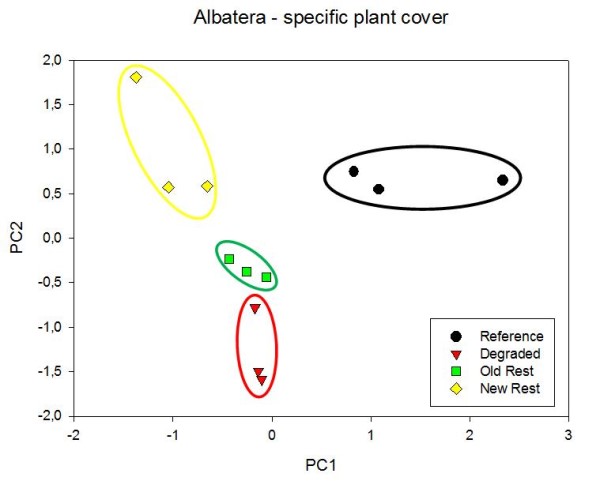
The reference ecosystem is characterized by Artemisia barrelieri and Fagonia cretica, with 17.9 and 13.1%, respectively, and the species with highest cover in the degraded areas is Fumana thymifolia (24.3%), with no other species with cover values beyond 6%.Globularia alypum is the most abundant species in the two restored sites (18.8 and 15.5% in the old and new restoration, respectively). The two first axes of the PCA carried out on specific plant cover explained 44.9% of the total variance and grouped all the plots by the defined state of the ecosystem (Figure 3). Along PC1 references separated from the other three groups of plots while the second axis discriminated the new restoration (highest values), the old restoration (intermediate) and the degraded plots (the lowest) (see Annex I for the species extraction on these two components).
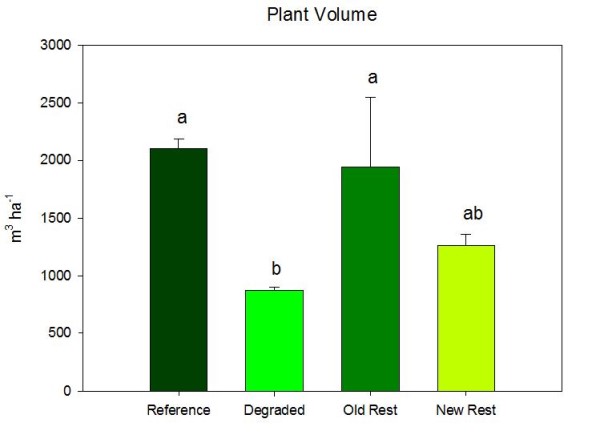
Plant volume (a proxy of plant biomass) in the old restoration was quite similar to that in the reference plots and more than 2.2 times higher than in the degraded areas (Figure 4). The new restoration showed intermediate values of plant volume (1259 m3/ha).
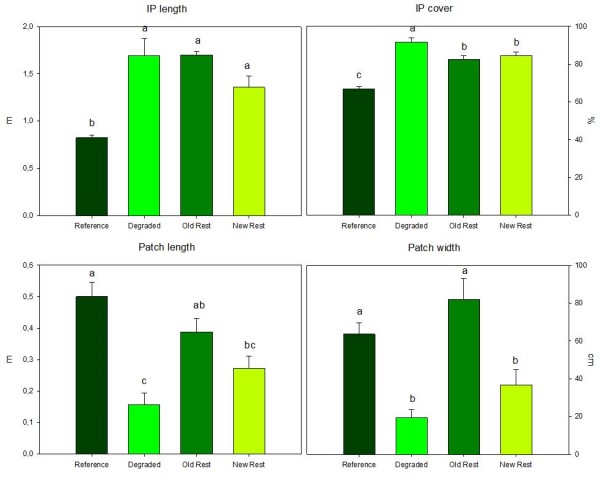
We noticed significant changes in the spatial arrangement and size of vegetation associated to degradation and the alternative restoration approaches (Figure 5). Interpatches are significantly shorter in the reference than in the other three states of the ecosystem but we observed a trend to decrease the length (20% shorter than in the degraded) in the new restoration sites. Interpatch cover was also enhanced due to degradation (from 66.9 to 91.8%) but both restorations significantly decreased the percentage of land corresponding to sink areas (82.7 and 84.5% the old and new restoration, respectively). The morphology of patches also changed with degradation and restoration. Patches in the reference averaged 0.50 m long and 0.64 m wide while in the degraded averaged 0.16 m long and 0.19 m wide. Old restoration produced patches significantly longer and wider than in the degraded areas and not different than the references (0.39 m long and 0.82 m wide), and the new restoration did not show significant changes of patch size than in the degraded plots.
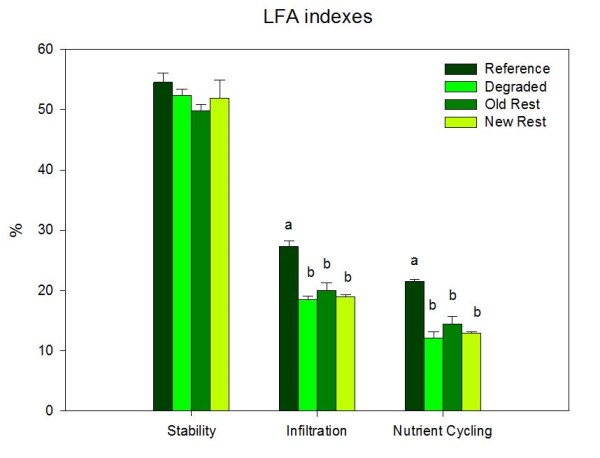
The largest changes in LFA derived indexes were observed in nutrient cycling and infiltration (Figure 6). However differences were only observed between the reference systems and the other three states of the ecosystem, with no significant change among them. We only noticed a trend to increase nutrient cycling and infiltration in the old restoration while the effects of the new restoration were even lighter. Changes in stability were minor and not significant.
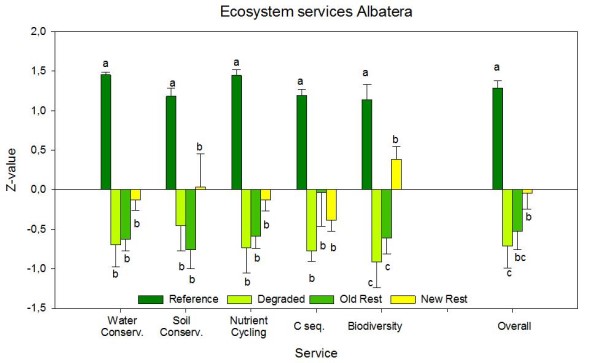
Long-term degradation had a severe impact on the services provided by the target ecosystem in Albatera (Figure 7). The reference state showed the highest values of all services and, consequently, also of the final averaged value. Only one service, biodiversity, was significantly improved by the new restoration approach but these areas also showed signs of improving soil and water conservation and nutrient cycling. The old restoration only tended to improve carbon sequestration. From the two restoration approaches, the new restoration resulted in better balance of ecosystem services than the old restoration. However, the two restored systems are still far from the services provided by the reference systems.
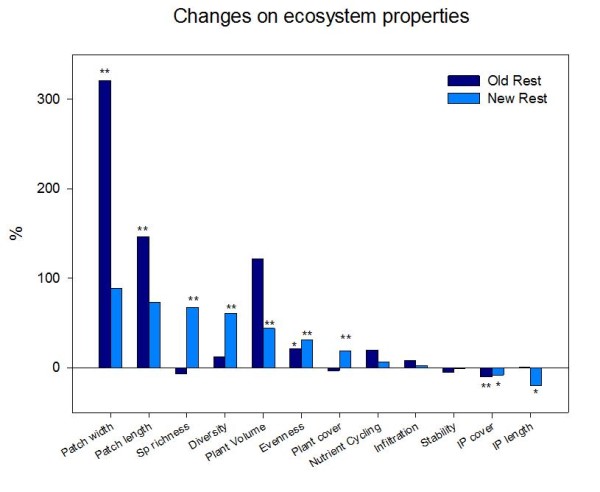
The two restoration approaches studied improved all the ecosystem variables considered in this assessment (negative values of interpatch cover and length are considered better conditions; Figure 8). The contrasted restoration options in Albatera affected different ecosystem variables, with old restoration affecting patch morphology and interpatch cover while new restoration positively impacted diversity indexes and plant cover and volume.
Note: For full references to papers quoted in this article see