| Main authors: | Bautista, S., Urghege, A.M., Camacho, A., Turrión, D., Jaime, L., Vera, M.A., Nazarova, V., Vega-Rosete, S., Sáez-Cases, A., Fuster, A., Morcillo, L., López-Poma, R., Valera, M., D. Fuentes, and Rodríguez, F., Bladé, C. and Mayor, A.G. |
| Editor: | Jane Brandt |
| Source document: | Bautista, S. et al. (2017) Dryland restoration dynamics and thresholds as a function of plant pattern and diversity. CASCADE Project Deliverable 4.3 31 pp |
For the CASCADE project, we built two large, unique experimental stations for the assessment of plant diversity and spatial pattern effects on dryland restoration by means of manipulative experiments at the scale of the plant community. Both the soil used (soil from old fields developed on limestone and marl substrates) and the plant species included in the cultures established (species from semiarid Mediterranean shrublands and steppes) are common in semiarid all across the Mediterranean Basin. For all the experiments conducted, climatic conditions were relatively dry (annual precipitation slightly lower than annual average).
The first station, ES24 (Figure 1), includes a set of 24 closed (2 x 1 m) plots, which allow event-based monitoring of runoff and sediment yields, and are meant to be used for short-term (few years) experiments. The plots were filled with soil from nearby degraded abandoned field, creating a slope angle of 25%. The soil was previously homogenized, sieved through a 2 cm mesh (to remove stones), and kept exposed to very dry conditions for weeks in order to dry out existing seeds and most of the soil fauna. This treatment allowed establishing quite homogeneous and relatively inert initial conditions in all plots, minimizing the influence of uncontrolled factors in the plant communities created for the experiment.
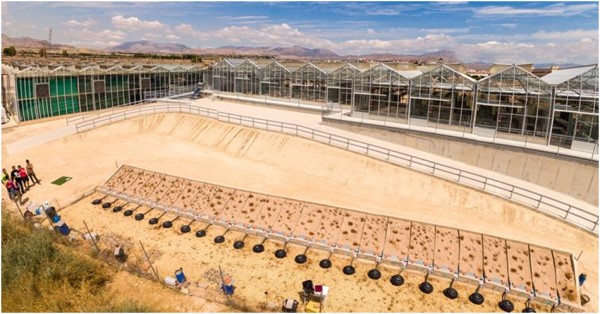
Figure 1 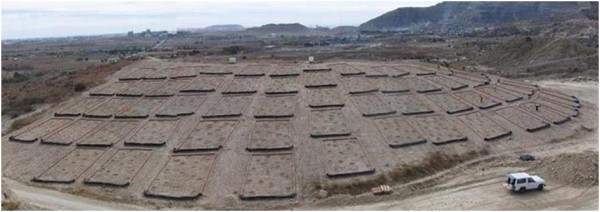
Figure 2
The second station, ES56 (Figure 2), consist of a large-scale set of 56 permanent (8 x 5 m) plots on an artificial slope built from aggregate mining overburden and soil from nearby abandoned degraded fields. This station aims to provide data on the role of species and functional diversity in dryland restoration success at the short-term, as well as a pioneer long-term experimental setting for the assessment of the interplay between biodiversity-function relationships and community-scale plant-plant interactions in shaping dryland vegetation dynamics.
Short-term experiments on ES24
We sequentially conducted two manipulative experiments on the ES24 set of plots, which focused on different aspects of the questions addressed in this part of CASCADE (see »Objectives, research questions and approach), and where patch cover, pattern, size and internal diversity were independently manipulated in order to test their independent and combined effects on restoration potential for a variety of plant communities created ad hoc. Each experiment was conducted over a period of 1-1.5 years.
The first experiment (experiment #1) conducted on ES24 was also used for the assessment of the feedbacks between the effect of pattern on resource conservation and the effect of resource availability back to vegetation (see »Potential for sudden shifts in ecosystems). However, this experiment also allowed investigating the role of patch size and diversity as well as the dominant plant-plant interactions within the plant patches for contrasting plant functional groups. We used 1-year-old plant seedlings of three different species to create artificial plant communities with contrasting patch size: big-patch pattern (6 big patches of 9 individual plants each), vs. small-patch pattern (18 small patches of 3 plants each), and contrasting diversity: mono-specific vs. diverse communities (Figure 3). Total number of plants per plot was the same (54 plants) for all plots, and initial cover values were very similar. The species used were one steppe grass (Lygeum spartum L.) and two shrubs (Atriplex halimus L., and Phillyrea angustifolia L.). In the “diverse” communities (polycultures), all the plant patches include the three species used (3 plants/species in the big patches; 1 plant/species in the small patches). In the “monospecific” plots, all patches include the same single species. There were 3 plot replicates for each treatment combination (2 patterns X 4 plant communities). We monitored plant performance over a one-year period, a time window that allowed testing the factors that controlled the establishment of the communities, after which the experiment was dismantled and all plants were harvested for biomass estimation (See »Potential for sudden shifts in ecosystems for further details on this experiment).
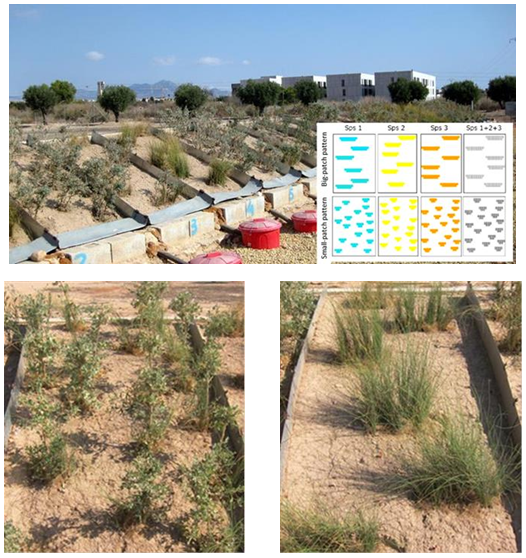
Figure 3 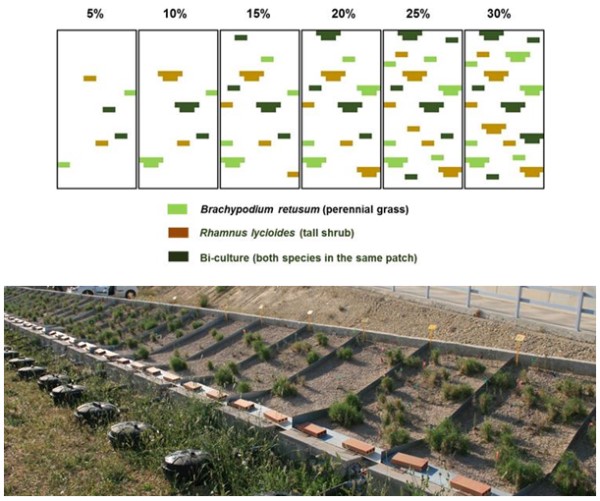
Figure 4
In order to assess the effect of the initial plant cover in combination with patch size and diversity, and to further explore the interaction between grass and woody species, we conducted a second experiment (#2) on ES24 using the perennial grass Brachypodium retusum (Pers.) P.Beauv. and the late-successional, deep-rooting shrub Rhamnus lycioides L. as target species. These two species represent very contrasting features regarding water use and are very abundant in natural semiarid shrublands in the Mediterranean Basin region. An outline of the different plant communities established is depicted in Figure 4. We compared six initial levels of patch cover values (5, 10, 15, 20, 25 and 30%), establishing four replicated plot for each level that varied in their spatial arrangement. Plant patches consisted of either two or six individuals, and were either mono-cultures (only B. retusum or R. lycioides plants) or bi-cultures (with plants of both species in the same patch).
Large-scale SE56 experiment
For this experiment, we created plant communities with varying levels of plant diversity and patch size by planting groups (patches) of varying diversity and number of young (6 months old) seedlings on bare-soil plots. The experimental design includes three factors: Species richness (S), with 4 levels (S1, S2, S4, and S8), corresponding with one, two, four and eight species respectively; functional diversity (F), with two levels (F1 and F4; one or four functional groups), and patch size (pz) with 4 levels (pz1, pz2, pz4 and pz8), corresponding with one, two, four and eight individuals per patch, respectively (Figure 5). The eight target species were selected to represent contrasting functional group in terms of life form and successional dynamics, and included to tussock grasses (Stipa tenacissima and L. spartum), two sub-shrub legume species (Anthyllis cytisoides and Dorycnium penthaphyllum), two seeder shrubs (Rosmarinus officinalis and Cistus clusii), and two tall, resprouter shrubs (Pistacia lenticus and P. angustifolia).
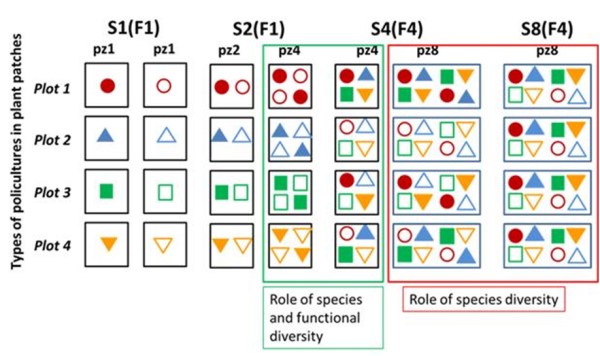
Figure 5
Comparisons of subsets of plots allow assessing the independent role played by the various factors, thus comparison of S4(F4) and S8(F4) plots allows assessing the role of species diversity (4 versus 8 species) for a given level of functional diversity (4 functional groups) (Figure 5).
Note: For full references to papers quoted in this article see