| Contributing Authors: | Matteo Jucker Riva, Gudrun Schwilch, Hanspeter Liniger |
| Editor: | Jane Brandt |
| Source document: | Jucker Riva, M., Schwilch,G., Liniger, H. 2016. A method for resilience assessment. CASCADE Project Deliverable 7.2, 61 pp |
Section 4 of the »Resilience Assessment Tool is dedicated to understanding the relation between the land management system and the shocks and disturbances that occur in the region in which the land management system is located (i.e. with the same natural and human environment) and that could affect the land management system in a negative way. Section 4.1 “Type and frequency of shocks and disturbances affecting the land management system” allows to identify all the disturbances that affect the land management system, without considering the permanent changes. Information about the frequency of return of the disturbance and the date of the last event is included.
- Question 4.1.1 “Can the shock or disturbance cause permanent change in the land management system?” focuses on the disturbances that could bring the system to a regime shift, and
- Question 4.1.2 “Under what conditions does the shock or disturbance cause permanent change?” asks on what aspect of the environment the disturbance will have permanent impact.
- Question 4.1.3 “Describe the impact of permanent change on the provision of services/functions” tries to outline the actual impact of a regime shift on the provision of ecosystem services.
Section 4.2 “Effectiveness of land management in preventing, mitigating or restoring the land management system after a shock” investigates the positive or negative role of each of the land management practices implemented on the disturbance. Finally,
- Question 4.3.2 “What additional land management practices could be used to prevent, mitigate or restore the land management system?” allows to indicate further management practices that could help reduce the impact of regime shifts and disturbances in general, using the WOCAT database as a main reference.
1. Most important shocks and disturbances affecting the system
To understand the resilience of a land management system it is important to identify the disturbances that can have an impact on the system. On this topic, merging scientific understanding with the knowledge of land managers is critical, because the latter can benefit from years of experience on disturbances events. More importantly, they can identify those disturbances that have a relevant impact on the system and can trigger a regime shift.
Table 1 shows the most relevant disturbances (in terms of negative impacts) for each land management system, together with the frequency and the last event that occurred in the region where the land management system is located.
Table 1: Most important shocks and disturbances per land management system.
| Study site | Most important shocks and disturbances | Frequency | Last event |
| Por_1 (Várzea) |
|
|
|
| Por_2 (Várzea) |
|
|
|
| SPa_2 (Ayora) |
|
|
|
| SPa_3 (Ayora) |
|
|
|
| Gre_1 (Messara) |
|
|
|
| Cyp_1 (Randi) |
|
|
|
| Ita_1 (Castel Saraceno) |
|
|
|
| Spa_1 (Albatera) |
|
|
|
Frequency (column 3) and last event (column 4) refer to events occurring not only in the land management system but also in the surrounding area. The variables considered are 41a-41z (see »Resilience Assessment Tool)
All of the land management systems analyzed report more than one disturbance having a relevant impact. In the land management systems analyzed fire is by far the most common, and it affects not only the forest systems but also the others, with the exception of Spa_1, where the vegetation density is too low for a fire to spread and of Ita_1, where the humid climate reduces the risk of fires. The second most common disturbance is drought that affects 5 out of the 8 land management systems, followed by pest and disease, that include both animal (relevant only for the pastoralist systems) and plants (relevant for all the system). In particular Ita_1 pastures are affected by wild boars that represent a major problem because they disrupt the grass layer in the pastures and damage the infrastructures; Cyp_1 is affected by brown rats, which attack the Carob trees and increase their mortality, contributing to land degradation and desertification. Ita_1 indicates “drop in value of production and of subsides for production” as the most impacting disturbance. Indeed the changes in the subsidies system and in the cheese market prices have had a profound effect on the land use and thus the environment of the land management system. Abrupt changes in the economic system as the one presented for Ita_1, are rarely considered in environmental studies on resilience; however they have an important effect on the land use and the land management, and thus indirectly on the environment.
The disturbances are indicated to be relatively frequent and occurred recently. It is surprising that relatively common disturbances, to which the systems must have adapted, can nonetheless trigger a regime shift. This seems to validate the hypothesis of the depletion of internal resilience mechanisms as the cause of regime shifts.
2. Threshold conditions and consequences of regime shifts
Thresholds conditions are particularly important to understand the evolution of a system (Briske & Fuhlendorf 2013): If a disturbance passes a threshold, the land management system is likely to undergo a regime shift and to be changed permanently. They depend on physical and biological processes, the state at which the system is found, and the several contextual factors. The topic of threshold is at the center of many recent studies (Briske & Fuhlendorf 2013; Briske et al. 2010; Mumby et al. 2014) but it remains very difficult to quantify thresholds for a specific situation.
Moreover, the impact of the permanent changes on the provision of ESS has to be investigated, together with the possibility that some new ecosystem services might be provided by the changed environment, and that could be the base for an adaptation strategy. Table 2 presents the description of thresholds grouped by disturbances and in relation to the disturbance regime, the state of the environment and the land use and management.
Table 2: Description of thresholds for disturbances in response to the question “Under what conditions does the disturbance cause permanent change?” in relation to the disturbance regime, the state of the environment, and the land use/management.
| Disturbance type | Disturbance regime (frequency and intensity) | State of the environment | Land use/management |
| Fire |
|
|
|
| Drought |
|
|
|
| Pests / diseases |
|
||
| Torrential rainfall |
|
|
|
| Floods |
|
||
| Drop in value of production |
|
|
Wildfire has a clear and quantifiable threshold related to the frequency of disturbances: Por_1, Por_2, Spa_2 and Spa_3 indicate that 2 fires within less than 10 (Por_1 and Por_2) or 20 years (Spa_2, Spa_3) can entail permanent changes. This is related to the time needed for the plants to reach sexual maturity and produce seeds between fires (Paula et al. 2009; Jucker Riva et al. 2016).
Gre_1, Cyp_1, Por_1 and Por_2 indicate also that the way the land is used after a wildfire (for grazing or for harvesting the wood) can provoke permanent changes in the land management system: this activity adds pressure on the vegetation in the moment it is more vulnerable and can easily bring the plants to die, preventing recovery.
The threshold for drought is related to individual plant resistance; however, there are no quantitative indications in terms of duration or intensity of the drought. In Gre_1, a relation is made between the drought and the stage of development of the plants: at the juvenile stage, after germination, plants go through a period of high vulnerability, which is generally considered to last three years. During this time, they are highly vulnerable to scarcity of water, nutrients, and light.
The term permanent change was used to refer to the changes caused by disturbances, which are likely to last more than 30 years. In the RAT we investigate both the permanent changes in the environment and in the provision of ecosystem services. The results are presented in Table 3, arranged by type of disturbance.
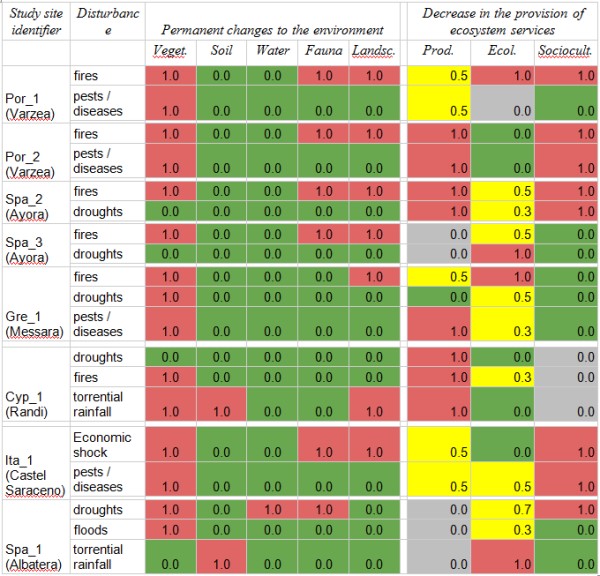
Legend: (green) no permanent change or impact (yellow) some ecosystem services are impacted (red) permanent change of the environment or decrease in ecosystem service provision (grey) there is no demand for the category of ecosystem service
Table 3 shows the negative impact of an above-threshold disturbance on the provision of ecosystem services. Vegetation seems the part of the environment most affected by permanent changes, while soil and water seems to be less concerned. Drought is the only disturbance that is considered not to bring about major changes on in the environment in several land management systems.
Most disturbances seem to affect a wide variety of ecosystem services. The specific ecosystem service that is affected depends on the system and it has been related to the demand of services. However, the provision of ecosystem services belonging to all categories (productive, ecological and socio-cultural) seems to be impacted by the disturbances that affect the system, in coherence with the concept of catastrophic shift: a regime shift in the environment induces a vast decrease in the provision of ecosystem services. One of the most threatened ecosystem services is “(E8) Protection from extreme events”, meaning that if an important disturbance occurs in the land management system, this will become less resilient also to other disturbances. This is a typical form of hysteresis, where feedback between degradation and disturbance prevent the system from recovering and can even lead to further degradation (Carpenter et al., 2009).
On the opposite, the land management systems assessed appear to be resilient to drought. As the description of thresholds for drought suggests (see Table 2), the occurrence of permanent changes is strictly related to the type of vegetation, thus the effects are very variable across different land management systems. The two land management systems that were assessed as less resilient to droughts (Spa_1 and Gre_1) are both characterized by a low scrubland vegetation that is severely limited in its development by reduced water availability (Spa_1 in particular) and low soil fertility (Gre_1). The other sites that generally have more diverse vegetation appear to have a more resilient environment. Productive ecosystem services, where important, do not appear to be hindered by droughts. This is probably due to the adaptation of the land use to the dry climatic conditions.
Pest and disease seem to induce permanent changes only in the vegetation. However they have a noticeable effect on productive services.
The RAT includes a question on what ecosystem services could increase after a regime shift. In effect, a change in the functioning of the system does not necessarily involve a decrease in the provision of ecosystem services. The services that could increase with a regime shift can constitute the base for an adaptation to the new conditions. The most striking example is that of unproductive shrublands that would be replaced by more palatable vegetation formations after a fire (Cyp_1) or the new land uses that would become possible if a forest is turned into a shrubland (Spa_2).
3. Does management increase resilience?
Land management practices are normally implemented to increase productivity of the land or to reduce degradation associated with land use. But their role regarding resilience depends on how they interact with the specific processes that regulate the occurrence of a disturbance, its impact on the environment and the post-disturbance recovery.
The last part of section 4 of the RAT is focused on analyzing the role of land management practices in preventing or mitigating disturbances or fostering the recovery of the land management system. Due to the variety of land management systems and of disturbances, no specific indicators were used to facilitate the evaluation.
Main questions related to this topic are:
- Question 4.2.1 "Does the land management prevent shocks or disturbances?” By prevention we mean to evaluate the influence of land management on the probability of shock or disturbance
- Question 4.2.2. "Does the land management mitigate shocks or disturbances?” that is defined by influence of land management practices on the degradation associated with a shock or disturbance.
- Question "4.2.3. Does land management help recover/restore the system after a shock?”
The expert is asked to answer these questions by choosing one of the statements presented in Table 4.
Table 4: Possible answers to questions 4.2.1, 4.2.2 and 4.2.3 on the impact of land management on the resilience of land management systems and value used for the quantitative analysis.
| Prevention | Mitigation | Recovery |
| -2 strong increase in probability of a shock | -2 Strong increase of degradation | -2 regeneration prevented |
| -1 increase | -1 Increased degradation | -1 regeneration decreased or delayed |
| 0 negligible | 0 negligible mitigation | 0 negligible |
| 1 decrease | 1 mitigation | 1 increased or faster regeneration |
| 2 strong decrease in probability of a shock | 2 strong mitigation | 2 full regeneration ensured |
Finally, with question 4.3.2 “What additional land management practices could be used to prevent, mitigate or restore the land management system?” we ask to describe additional land management practices that could be implemented in the area to increase the resilience of the land use system.
The evaluation was demanded for each individual land management practice in relation to each disturbance identified in question 4.1. The results are reported here first in individual form (Figure 1) and aggregated per each land management system (Figure 2).
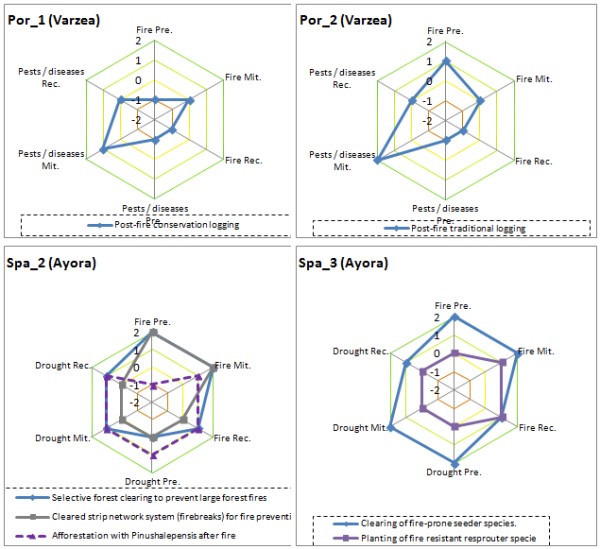
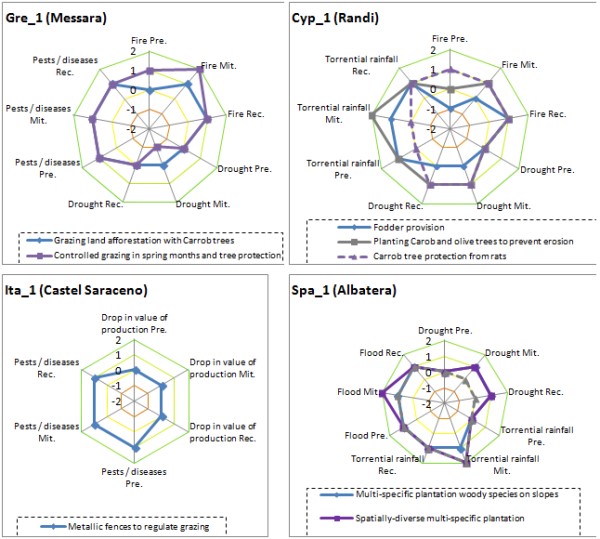
Values range from -2 (very negative impact) to 2(very positive impact). The center of the spider-web graph represents the value -2, the internal line correspond to the value 0 (no impact); the external line corresponds to 2(maximum positive impact). The terms “prevention”, “mitigation” and “recovery have been shortened in “Pre.”, “Mit.” and “Rec”. Variables considered are 4211, 4212, 4213, 4221, 4222, 4223, 4231, 4232, 4233 (see »Resilience Assessment Tool)
From the analysis of the results of the evaluation we do not consider the “Drop in value of production and subsidies for production” reported in the assessment of Ita_1, as we cannot directly establish a relationship between the economic disturbances and the land management practice, at least in the terms used here to analyze the environmental disturbances.
The graphs in Figure 1 show how diverse the impact of land management can be in preventing, mitigating or fostering recovery. The most striking example is the “traditional logging” in Por_1, that has opposites effect in prevention and mitigation of disturbances. The same can be said for the “Afforestation with Pinus halepensis” (Spa_2) and the “Fodder provision” (Cyp_1). Most technologies are judged to have a positive effect on mitigation of disturbances, while the prevention is rather difficult. This is related with the very nature of some disturbances like drought and torrential rainfalls that cannot be prevented through land management. Where more than one land management practice is implemented, the negative aspects are compensated by positive ones, with the exception of drought mitigation in Gre_1, for which the two land management practices have a negative or negligible effect. Overall, the negative impact of the land management practices is considered to be low, while almost all of them have a “negligible” impact in some situations, with the exception of the “clearing of fire prone species” in Spa_3 that seems to have an overall positive effect.
The aggregated results of the evaluation (Figure 1) show the impact of land management on resilience for each management system, and the values are based on the scoring method presented in Table 4.
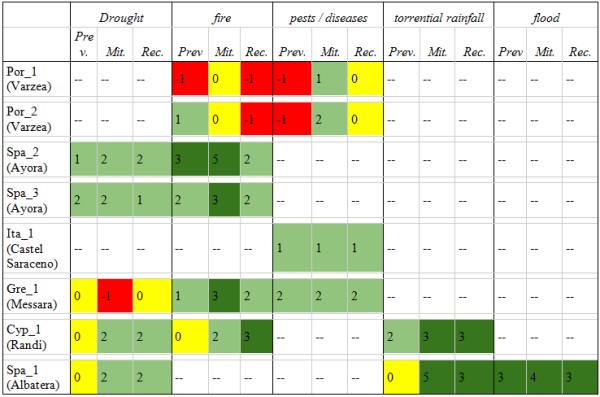
Color legend: Dark green = Very positive; Green = Positive; Yellow = Negligible; Red = Negative; White = the shock does not occur in the land management system. Variables considered are 4211, 4212, 4213, 4221, 4222, 4223, 4231, 4232, 4233 (see »Resilience Assessment Tool).
The system where the land management improves the resilience to disturbances the most is Spa_1 where the different re-vegetation methods have a positive impact on both floods and torrential rainfall. Spa_1 and Spa_2 are considered the most effective combinations of management practices to increase resilience toward the disturbances that affect the management system. In both systems three land management practices are implemented, and the combination has a particularly positive effect in mitigating the effects of torrential rain falls (Spa_1) and fires (Spa_2). Interestingly, both systems have a land management practice that increases the amount of vegetation, which has a positive effect on mitigation and also recovery.
The land management practices that are least beneficial are the logging of Por_1 and Por_2. Both land management practice do not aim at improving the environment in any way, but are rather focused on the productive aspects. It has to be noted that the “conservation logging”, the supposedly more sustainable practice, is assessed to be less beneficial to the resilience of the system, and is the only one that has an overall negative impact, while the effect of “traditional logging” is negligible. This is related to the fact that “conservation” logging includes leaving part of the dead material on the ground to reduce soil erosion, but this increases the fuel load and the dead material is a vehicle for spreading diseases (nematodes).
Table 5 shows what additional land management practices could be adopted to increase the resilience of the land management system to disturbances, as suggested by the local experts. While some of them are rather maintenance activities of already implemented land management practices (Spa_1, Spa_2 and Spa_3), others are autonomous land management practices, already implemented in other areas and for which detailed information is available in the WOCAT Technology database (Por_1 and Gre_1). This list of land management practices can serve as a base to improve land management and to engage in discussions with land users on how to improve the management of their land.
Table 5. Additional land management practices that could increase the resilience of the land management system to disturbances. Variables considered are: 432a, 432b and 432c (see »Resilience Assessment Tool)
| Study site name | Additional management practices that could increase resilience to shocks | Described in the WOCAT database |
| Por_1 (Várzea) | Prescribed fire | yes |
| Primary Strip Network System for Fuel load Management | yes | |
| Por_2 (Várzea) | Prescribed fire | yes |
| Primary Strip Network System for Fuel load Management | yes | |
| Post-fire forest residue mulch | yes | |
| Spa_2 (Ayora) | Control fuel | no |
| Reduce pine dead fuel requires recurrent management of the forest using chipped in-situ (wood and leaves) to cover the soil after a fire to reduce soil erosion | yes | |
| Spa_3 (Ayora) | Repeated selective clearing sometime after the implementation of the technique (e.g. 10 years) | yes |
| Gre_1 (Messara) | Terraces for slope and runoff reduction | yes |
| Cyp_1 (Randi) | Grazing exclusion | yes |
| Irrigation/ water harvesting | yes | |
| Mulching | yes | |
| Ita_1 (Castel Saraceno) | Combine sheep, goats and cows in order to both, prevent vegetation degradation and diversify production | no |
| Spa_1 (Albatera) | Irrigation in extremely dry periods during the first years after plantation | no |
| Maintenance work (e.g. of water harvesting structures) while needed | no |
4. Is management resilient?
Besides the impact of land management on the resilience of the land management system, it is important to evaluate the resilience of land management practices themselves, or in other words if the benefits provided by land management are stable, and how much the effectiveness of land management practices depends on contextual factors.
The most relevant questions for this topic are included in section 4 and section 5 of the RAT. At the end of section 4, with question 4.3.1 “What is the impact of shocks and disturbances on the effectiveness of land management?” we investigate how each of the land management practices analyzed will react to a disturbance. In section 5.5, titled “How does landscape influence the effectiveness of the land management practice?” we aim to understand what we call “spatial resilience” or the ability of a land management practice to be beneficial in different environmental conditions. The categories for the evaluation are the following: “Land management practice is fully effective”, “benefits of the LM practice are reduced”, “LM practice does not provide any benefit”, and “LM practice has negative impacts”. The spatial resilience is evaluated against aspect /orientation and steepness of slope, as well as previous land use history. Finally we look for other variables that could influence the effectiveness of the land management practice with question 5.5.4: “Impact of other landscape variable(s)”.
Figure 3 shows how the different land management practices react to the occurrence of a disturbance.
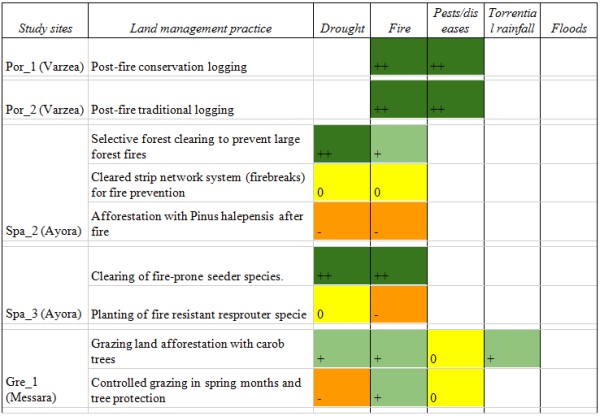
Legend: ++ Land management practice is fully effective; + Benefits of the LM practice are reduced; 0 LM practice does not provide any benefit; - LM practice has negative impacts. Variables considered are 4311, 4312, 4313.
Re-vegetation practices such as “Afforestation with Pinus halepensis after fire” (Spa_2), the “Planting of fire resistant resprouter species” of Spa_3 and the 3 woody plantations of Spa_1 appear to be the most sensitive ones, probably because they rely directly on the well-being of plants to be effective. An exception is the afforestation with Carob trees (Gre_1) which are very resistant both to fire and to droughts and which will only experience a decrease in effectiveness. To the contrary, land management practices that reduce the vegetation density like logging (Por_1 and Por_2), the “Selective forest clearing to prevent large forest fires” and the “Clearing of fire-prone vegetation” (Spa_3) display only minor impacts after a disturbance. Overall, drought appears to be the disturbance that has the most impact on land management practices.
For what concerns management practices related to grazing, it appears that “Controlled grazing in spring months and tree protection” (Gre_1) is the most vulnerable after a drought.
Figure 4 shows the assessment of the effectiveness of the land management practices under different slope steepness and orientations. Again, the re-vegetation practices seem to be the most delicate: “Planting Carob and olive trees to prevent erosion” (Cyp_1), “Planting of fire resistant resprouter species” (Spa_3) or “Fodder provision” (Gre_1). To this we have to add the practices that use heavy machinery such as “Selective forest clearing” (Spa_2) and the “Clearing of fire-prone seeder species” (Spa_3), that are strongly limited by steep slopes.
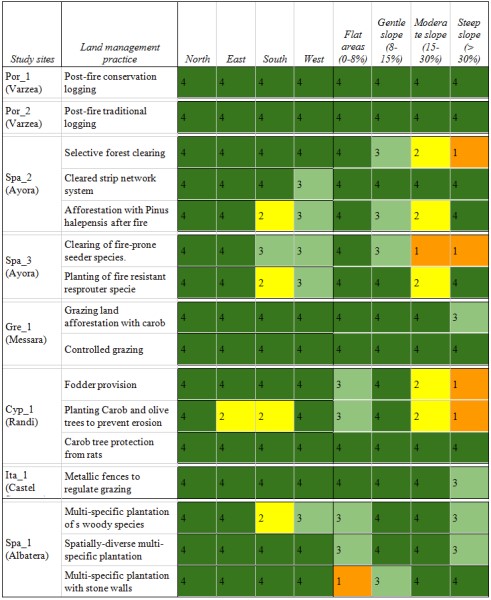
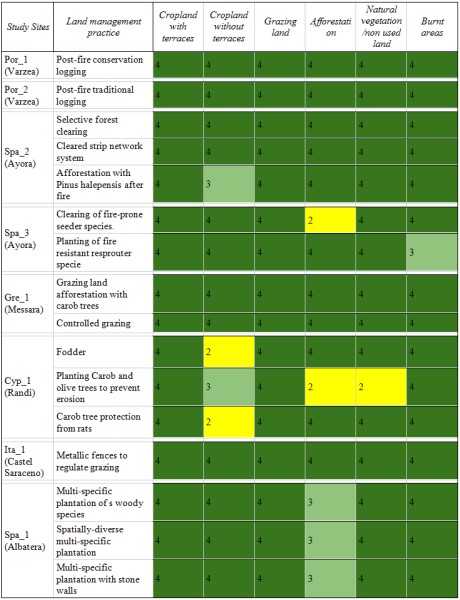
Legend for both figures: (dark green) Land management practice is fully effective; (light green) Benefits of the LM practice are reduced; (yellow) LM practice does not provide any benefit; (orange) LM practice has negative impacts. Variables considered are 5531, 5532, 5533
Finally, the effectiveness of land management practices is compared against different past land uses (Figure 5). As it was said previously, configurations of the land management systems can have an impact on its state today in terms of vegetation type, soil depth and composition and others.
It seems that most of the land management practices considered for the resilience assessment are not influenced by the land uses examined, with the exception of “Planting Carob and olive trees to prevent erosion” (Cyp_1) where the land management practice reduces its benefits if new plants have to compete with pre-existing vegetation.
Table 6 summarizes in column 3 the assessment of the spatial resilience of the land management practices, combining in one number the influence of orientation, slope steepness, and previous land use history. The maximum value (1) is obtained by the logging practices of Por_1 and Por_2, as well as by the controlled grazing, which is also independent from all factors considered. Also the clearing of fire–prone species has a low spatial resilience, because its implementation can become more difficult in steep areas or where there is a high presence of stones and outcrops in the soil.
The 4th column in Table 6 shows other factors that could prevent management to be effective. It is clear that soil conditions, and in particular the depth and the stoniness are important factor to consider when implementing a land management practice. Other factors that could reduce the effectiveness of management are related to the vegetation type (Spa_2), and the occurrence of disturbances (Por_1 and Por_2).
Table 6: Overall spatial resilience of different land management practices and other factors that could influence the effectiveness of management. Variables considered are 5531, 5532, 5533
| Study sites | Land management practice | Resilience of land management practices across different landscapes | Other environmental factors that influence LM effectiveness |
| Por_1 (Várzea) | Post-fire conservation logging | 1.00 | Fire intensity |
| Por_2 (Várzea) | Post-fire traditional logging | 1.00 | Fire intensity |
| Spa_2 (Ayora) | Selective forest clearing | 0.89 | Forest flammability, Soil type |
| Cleared strip network system | 0.98 | Forest composition and flammability | |
| Afforestation with Pinus halepensis after fire | 0.88 | Soil | |
| Spa_3 (Ayora) | Clearing of fire-prone seeder species | 0.80 | Stoniness/Outcrops, Grazing |
| Planting of fire resistant resprouter species | 0.89 | -- | |
| Gre_1 (Messara) | Grazing land afforestation with carob trees | 0.98 | Altitude |
| Controlled grazing | 1.00 | -- | |
| Cyp_1 (Randi) | Fodder | 0.86 | Soil composition |
| Planting Carob and olive trees to prevent erosion | 0.73 | Soil depth | |
| Carob tree protection from rats | 0.96 | -- | |
| Ita_1 (Castel Saraceno) | Metallic fences to regulate grazing | 0.98 | Soil depth |
| Spa_1 (Albatera) | Multi-specific plantation of woody species | 0.89 | Soil depth |
| Spatially-diverse multi-specific plantation | 0.95 | Soil depth | |
| Multi-specific plantation with stone walls | 0.91 | Soil depth |
Note: For full references to papers quoted in this article see