| Authors: | Bautista, S., Urghege, A.M., Morcillo, L., López-Poma, R., Camacho, A., Turrión, D., Fornieles F., Rodríguez, F. and Mayor, A.G |
| Editor: | Jane Brandt |
| Source document: | Bautista, S. et al. 2015. Report on the potential for sudden shifts. CASCADE Project Deliverable 4.1. 26 pp |
Critical questions and experimental design
To improve our understanding of the role of source–sink dynamics in plant productivity in drylands, and thus to gain insights on the local (patch-scale) effect of pattern-driven resource redistribution in these ecosystems, critical information about the relationships between plant-patch performance and the size, connectivity, and conditions of the inter-patch areas is very much needed. Questions of particular interest include:
- how does the size of the upslope runoff-source areas control soil water availability and plant performance in the respective downslope patch?
- What is the role of soil surface properties, connectivity and topographic features of the upslope runoff-source areas in modulating plant performance?
To address these questions, we examined the relationships between the characteristics of the respective upslope runoff-source areas and the performance of planted Mediterranean woody species in Albatera Long-term monitoring (LTEM) CASCADE site, in Southeast Spain. We hypothesized that the larger the upslope length and the larger and more runoff-prone the upslope inter-patch area (runoff-source area), the better the seedling performance.
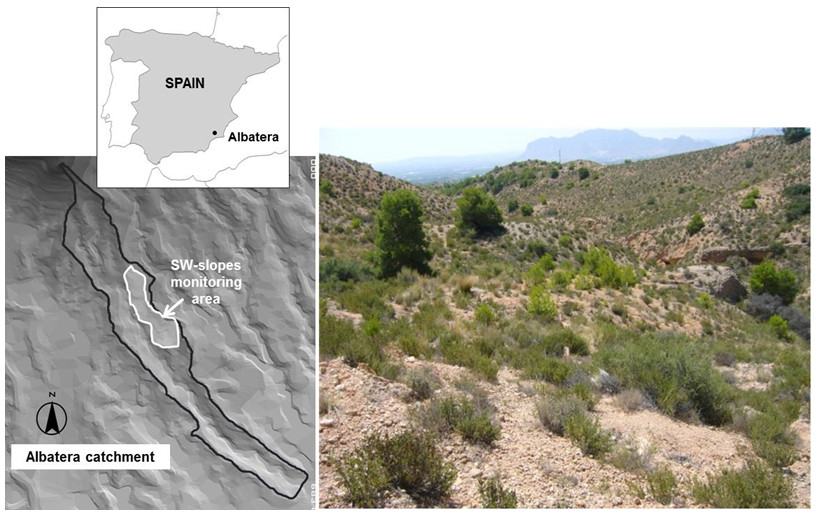
Albatera LTEM is a small catchment (24 ha) characterized by a semiarid Mediterranean climate with a very high interannual variability. Mean annual temperature is 18.7 °C and mean annual rainfall is 280mm. Monthly rainfall follows a bimodal distribution: two rainy seasons (spring and autumn) separated by a very dry summer. Soils are sandy-loam, shallow to moderately deep (20–60 cm), well drained, slightly basic, stony and with a very low nutrient content. Natural vegetation is composed mainly of sub-shrubs, such as Globularia alypum L., single or mixed patches of sod-forming short grasses, such as Brachypodium retusum (Pers) P. Beauv. and chamaephytes. Plant cover ranges from 34% to 48%. High cover of rock fragments and physical soil crusts are common on bare-soil surfaces, whereas biological soil crusts are almost absent.
Because of the degraded condition of the area, resulting from synergies between water scarcity and long-term resource exploitation, the Albatera catchment was selected by the Spanish National Plan to Combat Desertification as a demonstration area to implement and monitor innovative restoration strategies to combat desertification (Vilagrosa et al. 2008). In 2004, seedlings pertaining to a variety of evergreen trees and native shrubs were planted on the catchment area. Since then, seedling growth and survival have been monitored on a number of permanent plots. We established our sampling area (3500m² in size) on one of these long-term monitoring plots. Because of its south-facing aspect, this plot represents the most stressful condition in the catchment area. At the planting time (2004), plant density was 500 seedlings/ha, with planted seedlings distributed in a 4 × 5m regular pattern. We focused our study on two of the most widely planted species in Albatera: Pistacia lentiscus and Olea europaea var. sylvestris. These species showed contrasting responses regarding seedling survival, with overall survival values of ~80% for O. europaea and ~50% for P. lentiscus at the beginning of our experiment (2010), 6 years after the implementation of the restoration project. At that time, there were 21 (20 alive and 1 dead) O. europaea individuals and 27 (11 alive and 16 dead) P. lentiscus individuals in our sampling plot.
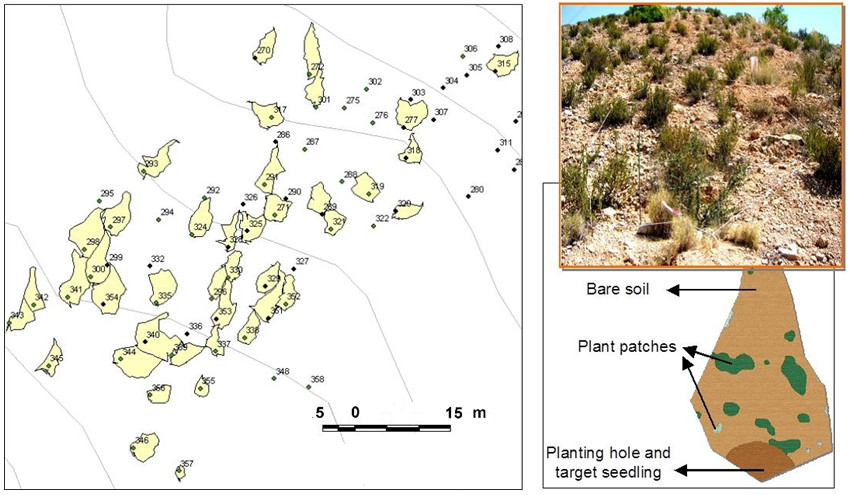
For each sampling plant, we assessed size, surface properties and topographic characteristics of its respective runoff-source area (hereafter, individual drainage microcatchment). For each alive seedling, we assessed a range of plant performance attributes related to plant growth (seedling growth rate over the first 6 years after planting, and final height and basal diameter 6 years after planting) and to plant water–stress level (relative leaf water content, specific leaf weight, and leaf and stem integrated water use efficiency, as estimated from δ13C natural enrichment; Farquhar et al. 1989).
To characterize the runoff-source area of the target seedlings, the perimeter of each individual drainage microcatchment was delineated and marked in the field. We then geo-referenced every target plant, captured the projected area of the associated microcatchments using a GPS (Trimble, GeoExplorer XH) with submetric resolution, imported this information into a Geographical Information System (ArcGIS, Environmental Systems Research Institute Inc., California), and mapped the location of the target plants and their respective microcatchments. From these maps, we calculated the distance between the target plants and the upslope hillslope boundary (upslope length). We outlined and mapped in the field the canopies of the plant patches located within each seedling microcatchment. The field maps were scanned and digitalized and used for estimating the hydrological connectivity of each microcatchment through the Flowlength index, developed by Mayor et al. (2008). This connectivity metric is based on the assumption that bare soil performs as runoff sources whilst vegetation patches traps resources, behaving as runoff sinks (e.g. Puigdefábregas et al., 1999; Reid et al., 1999; Ludwig et al., 2005; Bochet et al., 2006): a higher value of the index indicates a higher hydrologic connectivity of runoff-source areas. We further characterized the microcatchment surface conditions by estimating stone and soil crust cover on three bare-soil squares (0.5 × 0.5 m) per microcatchment.
To assess the role of microcatchment area and upslope length in modulating the amount of water inputs to the planted seedlings, we measured soil moisture in the planting hole of each target seedling for three consecutive sampling dates after a run of rainy days in May 2010 (26.6mm of accumulated rainfall) that generated several runoff events. Soil moisture was measured using a TDR100 tester (Campbell Scientific, Inc., Logan, USA) on one 25-cm long TDR probe vertically installed in each seedling planting hole. These measurements provided an integration of the volumetric soil water content in the top 25 cm of the planting hole.
For each species, we computed PCA analyses to integrate the information on growth and water-stress variables into independent single variables (PCA axis). For O. europea individuals, the PCA on growth-related variables resulted in one axis (hereafter PCA1–Growth) explaining 71% of the total variance and being positively correlated to height growth rate, seedling height, and basal diameter. The PCA on water-stress water–stress related variables resulted in two axes: the first axis (PCA1–Water–stress) explained 60% of the total variance and was positively correlated to stem δ13C and leaf δ13C, and negatively to RWC. This axis was interpreted as a proxy of the individual’s water–stress level, with higher values of this axis representing higher water–stress experienced by the plants. Similarly, for P. lentiscus individuals, PCA analyses resulted in one axis explaining 81% of the total variance for the plant growth-related variables (PCA1-Growth) and two axes for the water–stress related variables, with the first axis, explaining 50% of the total variance (PCA1-Water-stress). Further analyses for each species were performed with the first axes (components) that resulted from each of the PCA analyses.
Local effect of resource redistribution on plant performance
The hypothesis on the positive relationship between plant performance and the size of the associated upslope runoff-source area was supported by the observed growth response of O. europaea plants in our experiment. Thus, PCA1–Growth for O. europaea was positively related to the projected area of the individual drainage microcatchments. The assumption that the mechanism behind this relationship is the transfer of water and other resources from upslope runoff-source areas to downslope plant patches is in agreement with our results on soil moisture variation: for several days after a number of consecutive rainfalls, soil moisture showed positive relationships with microcatchment projected area, which eventually vanished when the soil became drier. This slow drying process suggests that increased soil water content due to runon inputs was evapotranspired at a relatively low rate, which could be explained by the conservative water strategy attributed to O. europaea (Hernández et al. 2011).
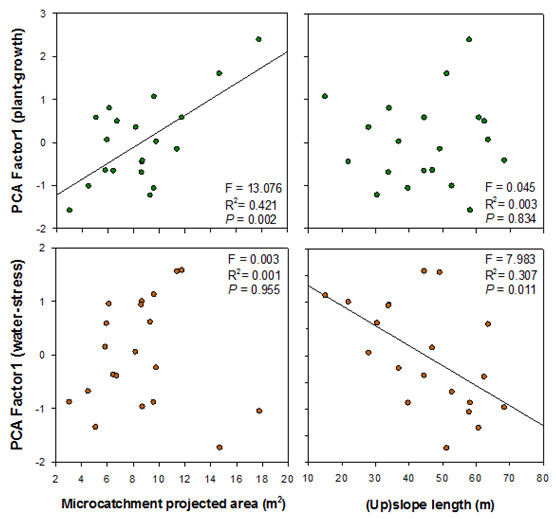
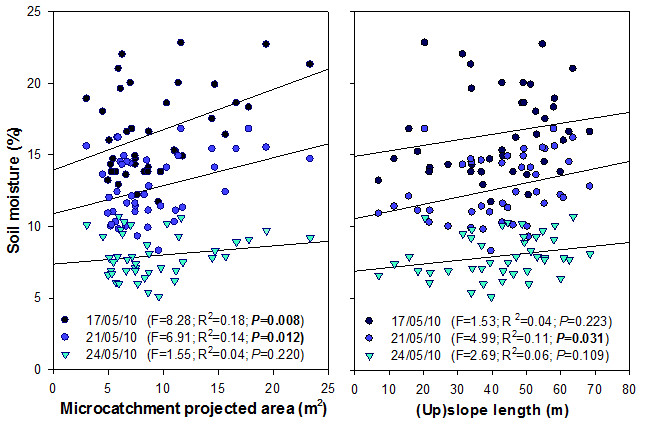
Surprisingly, slope length (upslope the target plant) showed no relationship with plant growth, which is in agreement with the weak relationship found between soil moisture and slope length. The general assumption of increased soil moisture in lower topographic positions has been often challenged in semiarid lands (e.g. Singh et al. 1998, Cantón et al. 2004). In our study site, topographic position barely controlled soil moisture, and certainly to a lesser extent than microcatchment size, which supports the contrasting response of plant growth to these two variables.
Conversely to seedling growth, the combination of variables related to the water–stress level of O. europaea plants (PCA1–Water–stress) showed a significant negative correlation with slope length, but no relationship with microcatchment size. These results suggest that factors associated to the topographic position, such as radiation load and evaporative demand for –more or less– exposed seedlings, could be more critical for seedling water–stress than factors such as microcatchment size that control extra surface water inputs during rainfall events.
Bare-soil connectivity (Flowlength) showed a negative (marginally significant) correlation with PCA1–Water–stress. This suggests that increased bare-soil connectivity within the drainage microcatchment could enable higher resource inputs to the vegetation downslope (Puigdefábregas 2005, Bautista et al. 2007, Mayor et al. 2008, Yu et al. 2008). However, the fact that Flowlength index showed a negative (though weak) correlation with seedling water–stress, but no correlation with plant growth suggests that connectivity-driven differences in runon inputs were too small at this scale as per having affected plant growth, yet they could have influenced water–stress during critical dry periods. For example, high hydrological connectivity close to the target plant can be essential for generating runon inputs after small rainfall events (Valdecantos et al. 2014), and this is crucial in Mediterranean drylands as most summer rainfalls are very small (Lázaro et al. 2001).
We found no relationship between plant performance and soil surface properties such as stone and crust cover. This result was unexpected, as the role of rock fragment cover and soil crusts in controlling water surface flows is well established (e.g. Poesen and Lavee, 1994; Belnap, 2001; Eldridge et al., 2010). However, at the spatial scale considered in our study, the potential effect of these surface features may result only in small changes in water inputs to downslope plants, insufficient to promote a relevant impact in plant survival and performance.
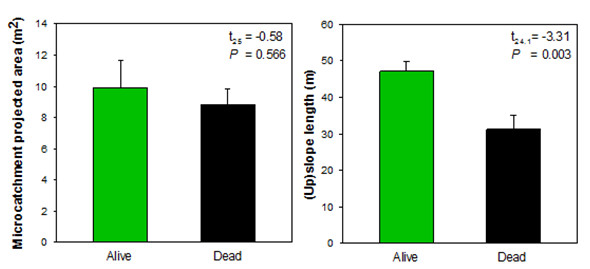
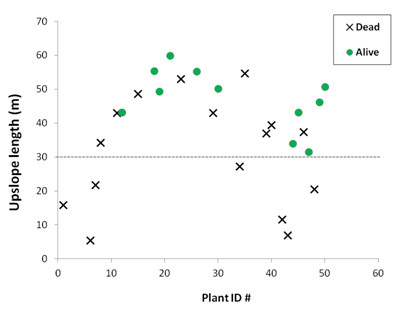
Survival of P. lentiscus seedlings was low. Alive seedlings of this species did not show any significant relationship between their growth or water–stress level and microcatchment characteristics, probably due to the low number of individuals available. However, the survival response of P. lentiscus was rather consistent with the response to stress of O. europaea. Thus, comparisons of microcatchment properties between dead and alive P. lentiscus individuals showed that survival of P. lentiscus did not show any significant effect of microcatchment size, whilst it significantly increased with slope length, with no alive P. lentiscus seedling found at less than 30m from the top of the slope. These results indicate that factors that control seedling water–stress rather than those that control seedling growth during favourable (rainy) periods seem to be the most critical for seedling survival in these environments.
In sum, the interplay between the size of the upslope inter-patch and the relative location on the hillslope, i.e. the upslope length, modulate the performance of plant patches in Mediterranean drylands, yet the strength of the effect and the relative role of each factor may vary with the species considered. Overall, our results prove that runon inputs from upslope inter-patch areas control seedling growth, while seedling survival and water–stress level is mostly controlled by the position on the slope. Thus, the larger the upslope inter-patch size, the higher the plant growth; while the lower the relative location on the slope, the higher the survival probability. The implications of these results must be considered in combination with the potential counterbalancing effects of inter-patch size at the global (slope, catchment) scale, as higher inter-patch size also implies higher resource losses from the slopes and therefore lower global resource availability for the vegetation (see »Feedbacks between plant pattern and resource conservation: a mesocosm experiment). Further research is needed to better define this optimum source:sink ratio for semiarid plant communities.
Both, inter-patch size and relative upslope length, should (and can easily) be considered in spatially-explicit models that represent dryland dynamics, where the combined impact of the global (slope, catchment) and local (patch) implications of these ecohydrological feedbacks could be assessed for a large variety of scenarios.
Further details of the work summarized here can be found in Urgeghe and Bautista (2014).