| Authors: | Bautista, S., Urghege, A.M., Morcillo, L., López-Poma, R., Camacho, A., Turrión, D., Fornieles F., Rodríguez, F. and Mayor, A.G |
| Editor: | Jane Brandt |
| Source document: | Bautista, S. et al. 2015. Report on the potential for sudden shifts. CASCADE Project Deliverable 4.1. 26 pp |
Critical questions and experimental design
Contrasting water infiltration between bare-soil inter-patches and plant patches (Bochet et al. 2006, Mayor et al. 2009) combined with physical obstruction of water flow by plant patches (Ludwig and Tongway 1996) drive the redistribution of water and other resources in drylands: bare-soil areas act as sources of runoff water, sediment, seeds and nutrients that travel downslope and are captured by vegetation patches (Tongway and Ludwig 1997). These source–sink dynamics are considered to control soil and water conservation in dryland systems at multiple scales (Wilcox et al. 2003, Ludwig et al. 2005, Yu et al. 2008). Although plant cover is considered to be the most critical vegetation property that control water and soil conservation in drylands, several works have pointed out that ecosystem efficiency in retaining water and sediments becomes higher as the density of plant patches increase and the grain size of the plant pattern decreases (Tongway and Ludwig 1997, Puigdefábregas 2005, Bautista et al. 2007). However, a decrease in the size of plant patches has been also considered a sign of land degradation (Kéfi et al. 2007). An ongoing debate exists on the relative importance of plant cover and plant pattern as indicators of ecosystem functioning (e.g., Kéfi et al. 2010, Maestre and Escudero 2010). It is worth noting that changes in plant cover and pattern are often linked, making difficult to disentangle and assess their relative ecohydrological roles. In order to do so, we independently manipulated patch cover and plant pattern and investigated their independent effect on runoff and sediment yield.
Using synthetic sponges (8 x 12.5 cm in size) placed on 2 x 1 m plots, we created different spatial arrangement of mimicked plant patches that ranged in patch cover (from 5 % to 30%), patch density (from 10 to 60 sponges/plot), and patch size (from 100 cm² to 600 cm², which represent patches made of 1 up to 6 sponge units). In addition, plots for intermediate values of patch cover (40 sponges/plot) and the various spatial arrangements considered (10, 20, 30 and 40 patches of decreasing size), were replicated three times (hereafter, replicated pattern plots). Table 1 shows the whole set of cover and pattern combinations considered (24 plots in total). The sponges were fixed to the soil using pins.
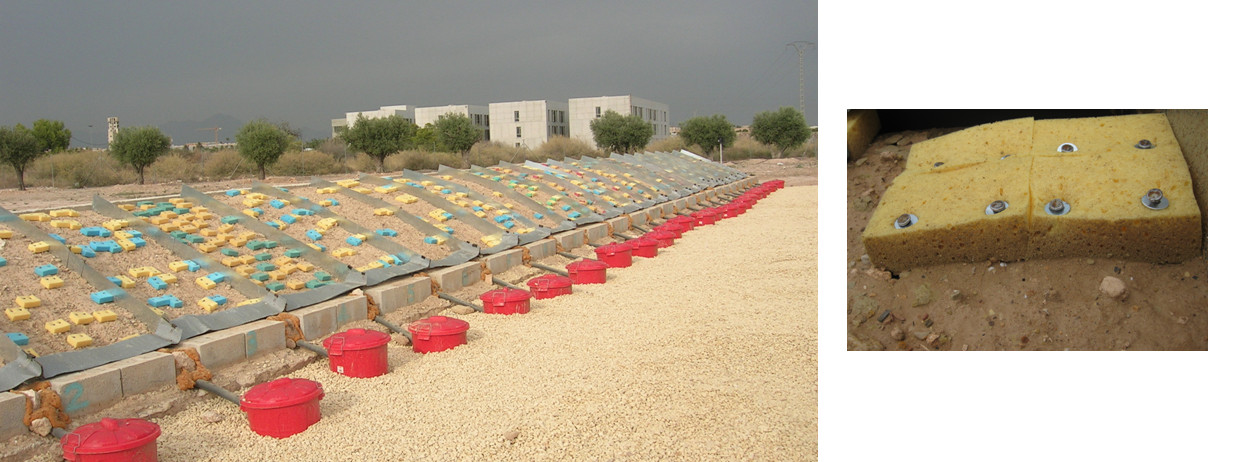
Table: Patch size (cm²) for each combination of patch cover and patch number, and total number of plots per each cover value
| Number of sponges (cover) | Number of patches | Total number of plots | |||||
| 0 | 10 | 20 | 30 | 40 | 60 | ||
| 0 (0%) | - | 1 | |||||
| 10 (5 %) | 100 | 1 | |||||
| 20 (10%) | 200 | 100 | 2 | ||||
| 30 (15%) | 300 | 150 | 100 | 3 | |||
| 40 (20%) | 400 | 200 | 133 | 100 | 4 x 3rep = 12 | ||
| 60 (30%) | 600 | 300 | 200 | 150 | 100 | 5 | |
In bold, Patch size in the replicated pattern plots: 3 replicates (rep) for each 20%-cover plot type (having 10, 20, 30 or 40 patches each).
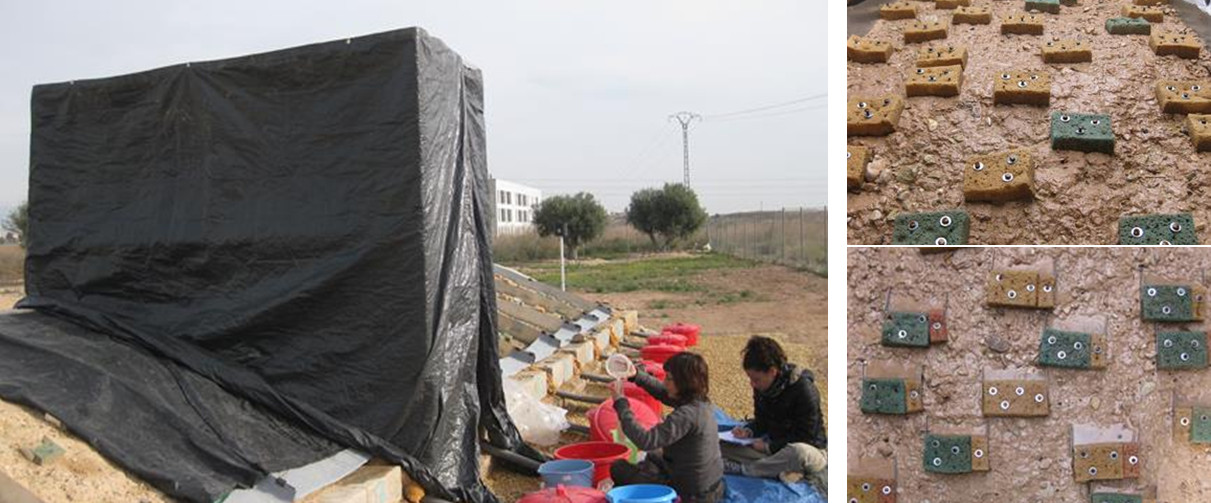
We monitored runoff and sediment yield after each natural rainfall event during the experimental period (6 rainfall events totaling 79 mm). In addition, to further explore the effect of patch pattern, we artificially increased the capacity of the patches for trapping runoff from overland flow by installing two small metal sheets on the laterals of the upslope side of each sponge (enhanced-sink patches) in the replicated pattern plots and conducted a set of high-intensity rainfall simulation experiments on these plots with and without the metal sheets. We used a large rainfall simulator, with two sprinklers that evenly distributed water over the entire surface of each 2 x 1 m plot, we applied a 65 mm h-¹ rainfall over a 30 minutes period on each replicated pattern plots (intermediate patch cover: 40 sponges/plot; four different patterns: 10, 20, 30 and 40 patches; 3 replicates per pattern type).
Results: Both plant cover and pattern matter
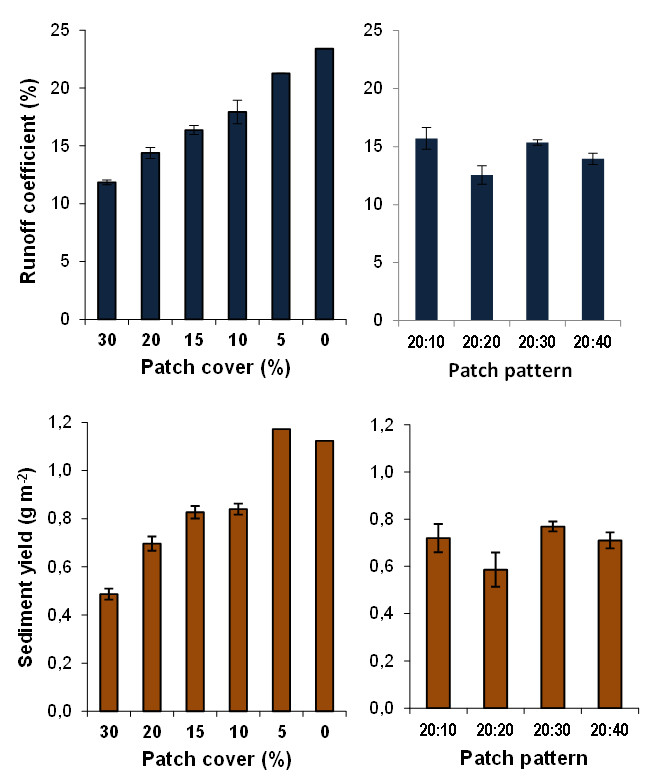
As expected, we found that increasing patch cover reduces the amount of runoff and sediments produced on our experimental plots, with runoff coefficient (percentage of rainfall that turns into runoff) and sediment yield being reduced by half on plots with 30% cover as compared with bare plots. Unexpectedly, we did not find a significant effect of patch pattern. However, under high-intensity rainfalls and particularly when the sink capacity of the vegetation patches was enhanced, the effect of patch pattern emerged, with coarser patterns (lower patch density; higher patch size) producing more runoff than finer patterns, for the same patch cover values.
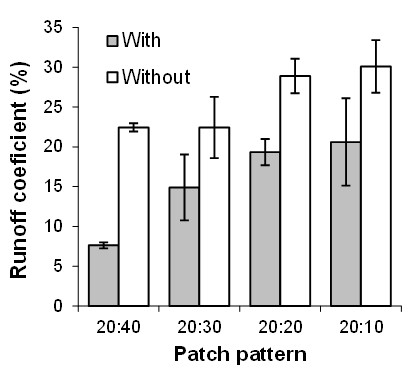
The well-known role of plant cover as control factor of runoff and sediment yield relies on the combined effect of several processes including rainfall interception by the canopies, physical disruption of overland flow, which promotes opportunities for water infiltration and sediment retention, and increased infiltration capacity and hydraulic conductivity in the soil underneath vegetation patches (Ludwig and Tongway 1996, Mayor et al. 2009). Mimicking vegetation patches by placing sponges on the soil surface allowed assessing the role of the first two processes: rainfall interception and physical disruption of overland flow. The addition to the sponges of a structure that captured runoff water allowed also mimicking and independently assessing the role of increased infiltration (sink) capacity of the soil underneath the plant patches. Overall, our results suggest that the control of overland flow by patchy vegetation relies mainly on increased water infiltration capacity under the plant patches rather than on rainfall interception and surface flow disruption. Thus, only mimicking rainfall interception and flow disruption resulted in no effect of patch pattern and a relatively small effect of patch cover as compared with data reported in the literature (e.g., Elwell and Stocking 1976, Francis and Thornes 1990), while mimicking all three processes revealed the effect of patch pattern. According to these results, runoff and erosion control measures that base only on creating physical barriers to overland flow could be of little value as compared with measures based on the establishment of vegetation patches, which have the potential for increasing water infiltration under their canopies.
The results from this manipulative experiment are conclusive about the relevance of both patch cover and patch pattern as hydrological control factors in patchy landscapes. However, patch cover appeared to be a stronger control factor, with patch pattern playing a subsidiary role that mostly relies on the sink capacity of the patches and exhibits its full potential only when the amount and/or the intensity of the rainfall result in significant overland flow and subsequent runoff source-sink dynamics. It is worth noting though that plant communities with similar low plant cover values but different plant pattern are common in semiarid lands (e.g., Abrahams et al. 1995, Bartley et al. 2006, Bautista et al. 2007). This fact suggests that plant cover alone may be not sufficient to predict runoff and sediment yield variation in semiarid lands. Our results support combining plant cover with other indicators that also capture plant pattern properties.