| Authors: | Bautista S, Fornieles F, Urgeghe AM, Román JR, Turrión D, Ruiz M, Fuentes D. and Mayor AG |
| Editor: | Jane Brandt |
| Source document: | Bautista S et al. (2016) The role of increasing environmental pressure in triggering sudden shifts in ecosystem structure and function. CASCADE Project Deliverable 4.2 35 pp |
This section of CASCADiS reports on our experimental findings regarding the role of a gradual increase in environmental pressure as trigger of sudden shifts in drylands towards degraded states.
Following a manipulative field experimental approach, we applied a gradually increasing pressure of vegetation removal, which aimed to mimic a gradient of accumulated impact of pressure (grazing and wood gathering). We then monitored resource loss (runoff and sediment yield), vegetation dynamics, bare-soil connectivity and soil-surface condition for ∼3.5 years.
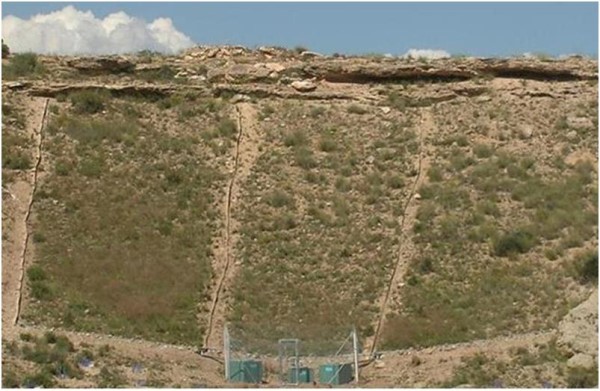
Before treatment 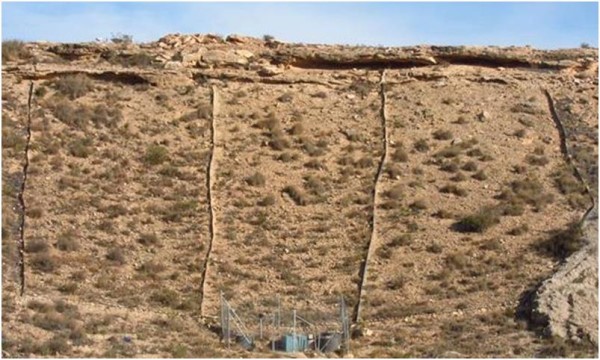
After treatment
The main objectives of this research were to experimentally assess the occurrence of tipping points towards a degraded state in response to decreasing plant cover, and to gain insights about the mechanisms underlying such dynamics. Specifically we aimed to test the following hypotheses:
- For a range of low cover values (close to suggested thresholds for irreversible degradation), a gradual decrease in cover results in a tipping-point response regarding resource loss (i.e., large, non-linear increase in runoff and sediment yield, as well as in rill development and erosion potential) once certain low cover value is surpassed.
- Resulting from the above response, soil functioning sharply decreases with decreasing plant cover, contributing to the net loss of resources and eventually to an ecosystem shift to a degraded state.
- Once the pressure is ceased, and depending on the plant cover that remains, the extant vegetation could either stabilize at its degraded state (if plant cover values were lower than a threshold value for degradation) or recover back to pre-treatment cover values and healthy state (if plant cover values were above that threshold).
- Increased inputs of resources from upslope bare-soil inter-patches enhance the performance and growth of the individual downslope patches, reducing in turn overall bare-soil connectivity, and thus contributing to prevent or delay a shift towards a bare-soil state.
Study area
The study area (38°23'02.0"N; 0°34'55.4"W) is an experimental slope located in the semiarid area of the province of Alicante, Southeast Spain. It is a south-facing slope, slightly concave, and with an altitude of 170 m.a.s.l. (top of the plot). Slope angle is approximately 30%. The climate is semi-arid Mediterranean. Mean annual rainfall is 311 mm, which mainly falls in autumn and winter, and mean annual temperature is 18°C (Alicante weather station, 81 m.a.s.l., 38°22'21''N - 0°29'39'W; period 1981-2010). The geological substrate consists of Upper Cretaceous Albian blue-green marls and limestones, with an upper limit of Plio-Quaternary caliche and clay materials (Martín-Algarra and Vera 2004). Soil is loamy, with a high cover of rock fragments; the surface soil layer (0-20 cm) contains 21% clay, 40% silt, 39% sand, and 1.4% organic carbon.
Overview and detail of slope
The vegetation on the slope is a semiarid grassland-shrubland mosaic, with patchy distribution of perennial grasses such as Brachypodium retusum, Lygeum spartum and Hyparrhenia hirta, scattered shrubs of Thymelaea hirsuta, Rhamnus lycioides and Salsola genistoides, and a variety of chamaephytes, such as Fumana ericoides and Asparagus horridus. Total vegetation cover, before treatment application in the area, was 61% ± 7%. The only recent land use of the area was marginal grazing.
Experimental design
On a set of three large-size (∼ 300 m² each) experimental plots, we mimicked a gradual gradient of pressure (grazing and wood gathering) by removing manually part of the vegetation cover to intended final values of approximately 45, 30, and 15%. Each cover level was randomly assigned to each plot. Plots were then labelled as IC45, IC30 and IC15, in agreement with their respective initial cover values at the beginning of the experiment. We targeted these values because they are close to the threshold of ∼30% proposed by Thornes (1985) and Francis and Thornes (1990) as critical value below which runoff and sediment yield would substantially increase and drive the system to irreversible degradation.
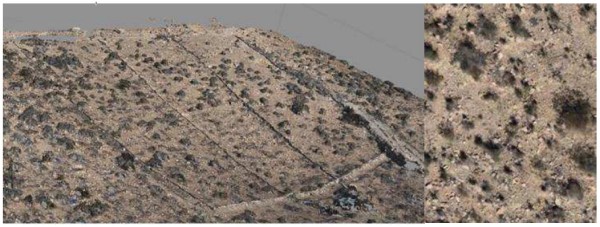
Using aerial images of the experimental plots, we mapped the spatial distribution of the vegetation of each plot as binary maps (vegetation patches and bare-soil interpatches) with a resolution of 0.5 x 0.5 m pixel size. For each plot, and taking into account the original percentage of vegetation pixels, we calculated the number of vegetation pixels to be removed (changed to bare-soil pixels) so that the resulting vegetation cover were the intended values of 45, 30, and 15%. Then, we randomly selected the vegetation pixels to be removed. The resulting maps (Fig. 4) were used as templates to guide the field implementation of the vegetation-removal treatment. With the help of parallel strings placed on the plots, we selected the 0.5 x 0.5 vegetated areas from which vegetation had to be removed in agreement with the guiding maps. Vegetation was removed by hand, uprooting the plants, or cutting them below the root collar when uprooting was not possible without digging. The soil surface was then compacted by stepping on it. The removal treatment was applied in November 2012.
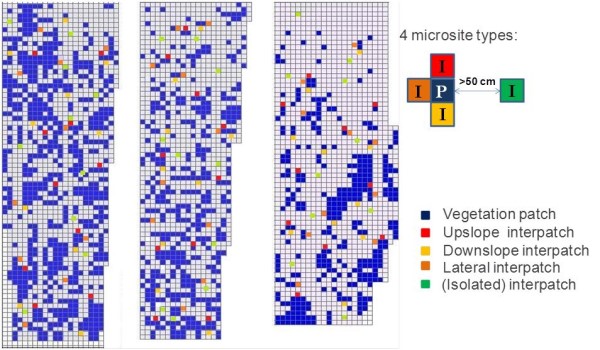
Plant cover map
For monitoring purposes (see »Measurements and monitoring), we randomly selected 4 groups of 10 bare-soil pixels each: 10 pixels located immediately upslope a vegetation patch; 10 pixels located immediately downslope a vegetation patch, 10 pixels lateral to a vegetation patch, and 10 isolated interpatch pixels with no contact with vegetation.
Before the vegetation removal treatment, the experimental plots were inter-calibrated to assess natural variation between them in total runoff and sediment yield. For two years prior treatment application, we measured runoff and sediment yield (see »Measurements and monitoring) from the three plots. This long inter-calibration period allowed considering a wide range of variation in rainfall amount and intensity values for the comparative analyses of the hydrological response of the three experimental plots. The inter-calibration of the experimental units for the target processes studied is the standard procedure to control treatment effect when there are not replicates for the treatments applied. This approach, which is an extension of the “paired catchments” approach, has been widely used to assess the impact of land use or vegetation change on catchment hydrology (Bosch and Hewlett 1982). Such studies involve the use of two or more catchments with similar characteristics in terms of slope, aspect, soils, area, precipitation and vegetation located adjacent to each other. Following a calibration period, where all catchments are monitored, the catchments are subjected to different treatments. The change in the hydrological behaviour can then be attributed to changes in vegetation due to the treatment (Bosch and Hewlett 1982, Lane and Mackay 2001, Best et al. 2003).
Note: For full references to papers quoted in this article see