| Main authors: | Cecilia De Ita, Lindsay C. Stringer, Luuk Fleskens, Diana Sietz |
| Contributing authors: | Ioannis K. Tsanis, Ioannis N. Daliakopoulos, Ioanna Panagea, Michalakis Christoforou, Giovanni Quaranta, Rosanna Salvia, Sandra Valente, Cristina Ribeiro, Cláudia Fernandes, Oscar González-Pelayo, Jan Jacob Keizer, Alejandro Valdecantos, V. Ramón Vallejo and Susana Bautista |
| Editor: | Jane Brandt |
| Source document: | De Ita, C. et al. (2017) Report on multi-scale evaluation of CASCADE's management principles and grazing model scenarios with stakeholders and policy makers. CASCADE Project Deliverable 8.3 69 pp |
Modelling approach
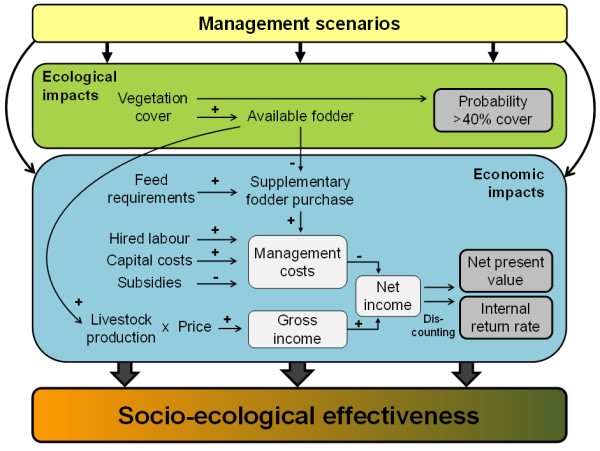
Using the modelling strategy outlined in »Socio-ecological effectiveness of land management (for a summary see Figure 1), we assessed the socio-ecological effectiveness of selected management scenarios considering non-linear ecosystem dynamics and windows of opportunities and risks (Sietz et al., 2017). These management scenarios capture key management recommendations from »Guidelines for natural resource managers which are mainly based on aspects perceived by stakeholders. We modelled ecological and economic implications of these recommendations as a basis for stakeholder evaluation in Cyprus and Crete. The evaluation particularly revealed insights into the realism of modelled vegetation trends and cash flow series differentiating the usefulness of management principles according to particular study site conditions and stakeholders’ perceptions and expectations.
The management scenarios represent adaptive management strategies including opportunistic and conservational grazing management in combination with a varying degree of environmental and economic risk aversion (Table 1, see »Socio-ecological effectiveness of land management). Among these, the baseline scenario depicts a commonly used opportunistic management strategy and least risk aversion. Scenarios S1 and S2 also represent opportunistic management approaches but with higher risk aversion, while scenario S3 captures a conservation management practice, called `resting in wet years`, together with extreme risk aversion. The ‘resting’ implies that livestock density remains below the grazing capacity in wet years to support the recovery of vegetation allowing potentially higher stocking rates in the near future. Two starting conditions were chosen by the research team, i.e. degraded and restored sites (Table 1), providing a basis to discuss management impacts at various levels of initial vegetation cover. The impacts of scenarios S1-S3 are compared with the implications of the baseline scenario in order to provide an estimate of how far the ecological and economic impacts deviate from the common management situation. This allows us to discuss relative changes in vegetation dynamics and benefits derived from livestock production.
Table 1: Scenarios of adaptive land management. (Note: Start conditions at degraded site are 45% vegetation cover (both Cyprus and Crete) and at restored site 73% (Cyprus) and 52% (Crete)).
| Management scenario | Description | Start conditions |
||
| Degraded sites | Restored Sites | |||
| Baseline scenario | Least risk aversion | If vegetation cover smaller 30% → reduce number of animals grazed on pasture to half | X | X |
| Scenario 1 (S1) | Intermediate risk aversion | If vegetation cover smaller 40% → reduce number of animals grazed on pasture to half | X | X |
| Scenario 2 (S2) | High risk aversion | If vegetation cover smaller 50% → reduce number of animals grazed on pasture to zero | X | X |
| Scenario 3 (S3) | Resting in wet years and extreme risk aversion | In wet years and if vegetation cover smaller 60% → reduce number of animals grazed on pasture to half | --- | X |
Model Results
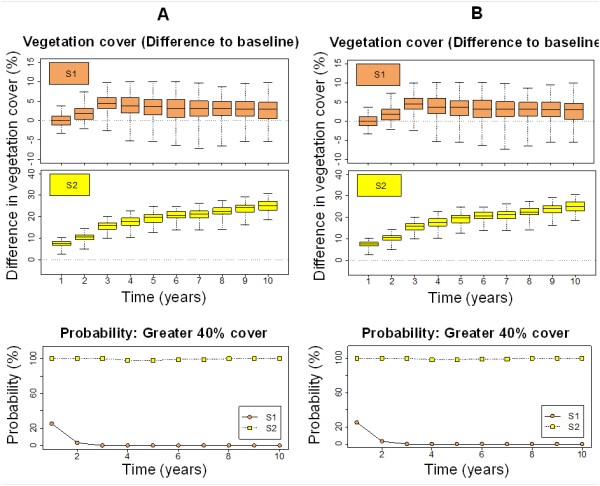
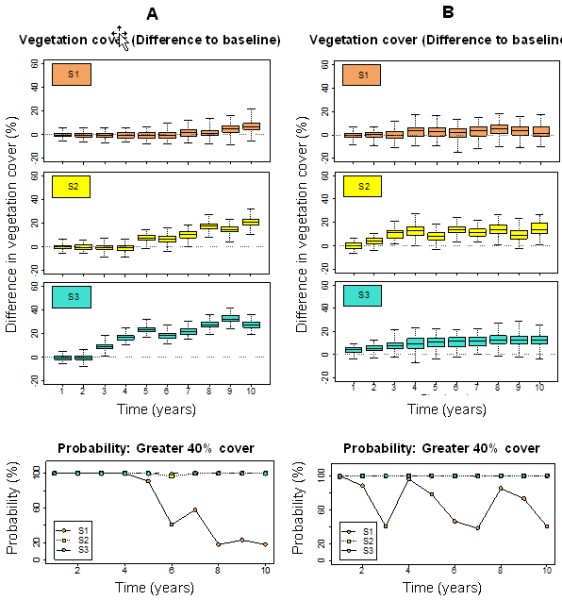
Starting with a degraded rangeland, the model results show that S1 causes the vegetation cover to slightly increase compared with the baseline scenario in Cyprus and Crete (Figure 2). This scenario results in a low probability of reaching >40% vegetation cover but only in the first year (Figure 2). Vegetation cover remains below 40% in the remaining years. In contrast, S2 induces a more pronounced increase in vegetation cover and high probability of reaching >40% vegetation cover throughout the 10-year period (Figure 2). Similar to S1, the modelled ecological effects of S2 are alike in Cyprus and Crete.
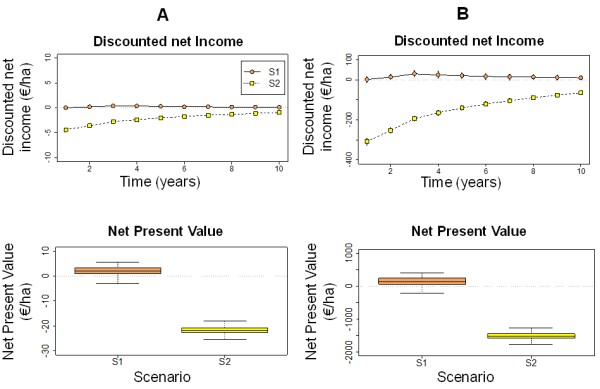
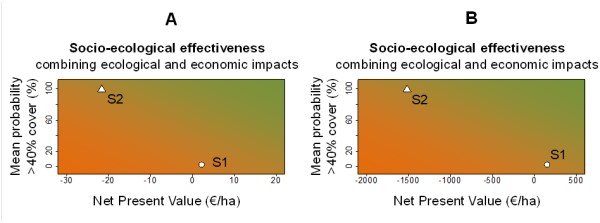
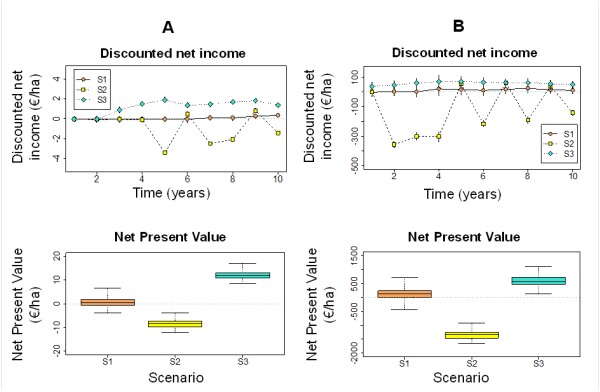
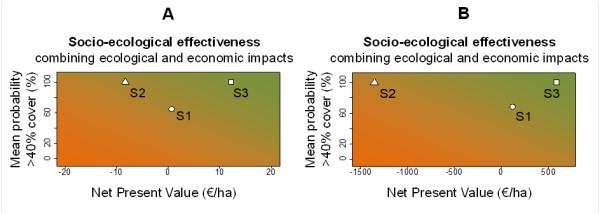
S1 results in economic gain (positive net income, though very low), while S2 depicts economic loss (negative net income) in both Cyprus and Crete (Figure 3). Reflecting regional differences in economic costs and benefits of livestock production, S2 resulted in an economic loss of about 1600Euro/ha in Crete but only 25Euro/ha in Cyprus (see Net Present Value in Figure 3). Regarding socio-ecological effectiveness (Figure 4), these results indicate that even though S2 is more effective in ecological terms, this scenario is more costly due to the need for alternative fodder provision, and therefore likely to be less attractive to land users.
Considering a restored site as a starting condition, model results indicate that S1 induces a slight increase in vegetation cover while S2 and S3 yield a significant vegetation cover increase and highest probability of reaching >40% vegetation cover throughout the 10 years in both Cyprus and Crete (Figure 5). In economic terms, S1 results in a very low economic gain and S2 even in economic loss in both regions (Figure 6). Due to regional economic costs and benefits of livestock production, S2 results in an economic loss of about 8 Euro/ha in Cyprus and 1400 Euro/ha in Crete (Figure 6). Only S3 yields a larger economic gain of about 12 Euro/ha in Cyprus and 600 Euro/ha in Crete (Figure 6). Together with the vegetation cover increase induced by S3, this economic gain implies best socio-ecological effectiveness among the scenarios considered here (Figure 7). Although S2 effectively prevents degradation below the critical level of 40% vegetation cover, the economic loss indicates that policy incentives such as subsidies would be useful to increase land users’ motivation to implement this type of management.
Note: For full references to papers quoted in this article see